E. Palle Bago and C. J. Butler
Paper appeared in Astronomy & Geophysics, August 2000. Vol 41, Issue 4, pp 18-22.
Abstract
We analyse the new ISCCP (International Satellite Cloud Climatology Project) D2 cloud data to ascertain whether or not a connection between cosmic ray flux and cloud cover exists. Despite a previous finding that total cloud factor and cosmic ray fluxes were correlated, our results indicate that only the low-level cloud follows solar activity over the full period, 1983-1994. Using several proxies for solar activity and the radiative forcing calculated by Ockert-Bell (1992) for the ISCCP cloud types, we estimate the possible impact that such a solar-terrestrial connection may have on climate. We conclude that, possibly excluding the most recent decades, much of the warming of the past century can be quantitatively accounted for by the direct and indirect effects of solar activity.
Introduction
The extent to which the recent global warming has an anthropogenic origin (e.g. via the enhanced greenhouse effect) as opposed to a natural origin (e.g. through volcanic activity or solar variability) is of crucial importance for our understanding of how the Earth’s climate has varied in the past and how it may vary in future. Detailed fits of global and hemispherical temperatures since the mid-19th century with empirical models involving the enhanced greenhouse effect and solar variability require at least one parameter linked to solar activity for a satisfactory fit in the mid-20th century (Kelly and Wigley, 1992; Soon et al. 1996). In general, these fits use variable “stretching factors” to amplify the sensitivity of the models to the parameters in question. For example, the simplest form of solar variability, namely a direct increase in solar irradiance as a result of increasing solar activity, requires an amplification factor of ~5 to quantitatively explain the observed global temperature change.
Various physical mechanisms have been proposed to produce this amplification, including: alteration of the atmospheric circulation pattern as a result of changes in solar ultraviolet radiation during the solar cycle (see Haigh, 1996; Shindell et al. 1999), a long-term drift in the solar irradiance related to the strength of the Sun’s magnetic field (see Lockwood and Stamper, 1999), and a modulation of the Earth’s albedo by changes in cloudiness resulting from changes in the flux of galactic cosmic rays, (Svensmark and Friis-Christensen, 1997). This last mechanism looked particularly promising after a strong correlation between cloud factor over mid-latitude oceans and cosmic ray flux was found by these authors for the period 1984-1991. They suggested that cosmic rays promote the formation of terrestrial clouds through ionization of particles in the troposphere. As both the flux and the energy spectrum of cosmic rays are known to be modulated by the interplanetary magnetic field, which in turn is strongly influenced by the magnetic field of the Sun, it is feasible that cosmic rays provide the link whereby solar activity affects the global climate (Svensmark,1998). It is this possibility which we explore further in this paper.
Data
In order to gain some insight into how cosmic ray modulated cloud may influence climate, we need to analyse how the cloud cover over the whole Earth has changed over recent decades. In our study, cloud factors from observations by a number of geostationary satellites linked together and calibrated by satellites in polar orbits, have been used. The recent re-compilation and re-calibration of this data by the ISCCP project has resulted in the D2 dataset which is believed to be superior to the earlier C2 dataset in its detection of low clouds at high latitudes and in its ability to distinguish cloud type (Rossow et al. 1996). In addition, the D2 data are currently available from 1983 to 1994, three years longer than C2. The use of the D2 data may overcome some of the criticisms concerning the quality of the ISCCP C2 cloud data raised by Kernthaler et al. (1999).
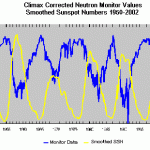
As cosmic ray fluxes from neutron monitors at different sites vary proportionately to one another, we have used the data from just one long-duration site, namely the Climax station (1953-1999) in our analysis. Also, because cloud formation processes probably differ in different meteorological regimes, such as pertain for instance over the tropics and the poles, and the cosmic ray flux is known to be dependent on magnetic latitude, we have examined the correlation between cloud factor and cosmic ray flux in different latitude zones, separately.
Correlation between cosmic ray flux and cloud factors
Our first objective was to ascertain whether or not previous reports (Svensmark and Friis-Christensen, 1997; Svensmark, 1998), that the total cloud cover over mid-latitude oceans, excluding the tropics, (hereafter SFC zones) correlates strongly with cosmic ray flux, are substantiated by the new data. In Fig. 1 we plot the total cloud cover over this latitude range together with the cosmic ray flux, suitably scaled for overlap. We note that a close correspondence between the cosmic ray flux and total cloud cover is maintained from 1983 till 1991, the period previously studied, but that subsequent to this, the curves diverge. Thus, when we include the data from 1992 to 1994, we find that the new D2 data series does not confirm the previous findings in respect to the total cloud cover.
Since the D2 dataset gives more reliable cloud-type information, our second objective was to explore the possible dependence of cloud factor on cosmic rays for different cloud types and in five different latitude zones; namely: (a) the whole Earth, (b) the tropics lat < 22.5 degrees, (c) the mid-latitudes 22.5 < lat < 60.0 degrees, (d) the polar regions lat > 60.0 degrees and (e) the mid-high latitude oceans (SFC regions) lat > 22.5 degrees. In Fig 2 we show the infrared observed mean monthly cloud factors for these regions for low, medium and high altitude clouds (2, 4.5 and 10 km mean altitude respectively), each smoothed with a twelve-month filter to eliminate seasonal effects. Also shown is the total cloud cover determined from visible and infrared radiation.
With reference to Fig. 2, we note the following: (1) the good correlation between total cloud factor and cosmic ray flux from 1983-91 breaks down for all zones after 1991; (2) the high level and mid-level clouds show no systematic variation over the period 1983-94; (3) the low-level clouds for all latitude zones excluding the poles are well correlated with the cosmic ray flux over the period 1983-94 with correlation coefficients of 0.87, 0.72, 0.88 and 0.92 respectively. Because satellite observations of low clouds must penetrate higher clouds, it might have been suspected that any modulation of low level cloud factor was due to changes at higher altitudes, as only the non-overlapped portion of the low clouds is viewed by the satellite (Kernthaler et al. 1999). We think this is unlikely for two reasons: firstly, the observed lack of variability of higher level clouds and secondly, because the amplitude of change in low cloud factor exceeds that of mid and higher level clouds combined. We are reassured in our conclusion by our analysis of daily cloud cover, the results of which will be given in a future paper.
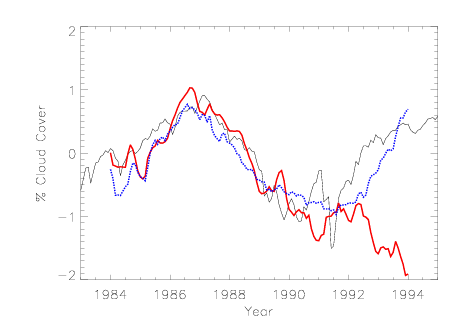
Figure 1
Total cloud cover (solid red line) and low cloud cover (broken blue line) over the SFC areas as obtained with the D2 dataset from infrared (low clouds) and visual plus infrared (total cloud) observations. The thin black line represents the Climax Cosmic Ray Flux scaled for comparison. Note how the previously good correlation between the total cloud cover and the cosmic ray flux breaks down after 1991/2.
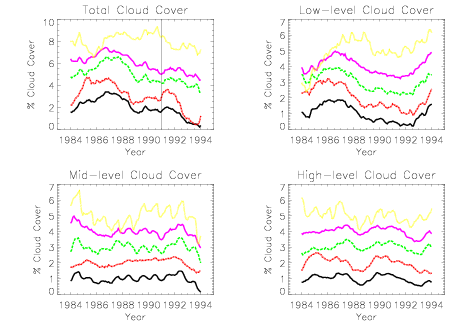
Figure 2
Here we plot in four separate panels the 12-month running mean of the total, low-level, mid-level and high-level cloud cover for the period 1983-1995 covered by the ISCCP D2 dataset. Five different series are represented in each panel: Cloud cover over the whole Earth (black line), the tropics (red line, lat < 22.5 degrees),mid-latitudes (dashed green line, 22.5 to 60 degrees), poles (dotted yellow line 60 to 90 degrees) and over the SFC zones (ocean areas excluding the tropics, magenta line). Cloud cover is measured as the fraction of the sky covered by clouds. A vertical line is plotted in the first panel to link with Fig 1. The amplitude of the cloud cover variation is real, but the mean value is shifted for plotting purposes.
All panels cover the complete diurnal cycle, however total cloud cover is determined from visible and infrared radiation whereas cloud data for separate levels are determined from the infrared radiation only.
Correlation of the low cloud factor with various activity-related parameters
Provided the high degree of correlation between global low cloud cover and cosmic ray flux is stable, the above results allow us to estimate cloud factors during the period 1950-1983 when cosmic ray fluxes are known, but satellite cloud factors are unavailable. Taking things one step further, it may also be possible to estimate the effect on the global energy balance of the predicted change in low cloud factor. Prior to 1950, however, cosmic ray fluxes are unavailable and we can only use other activity-related parameters, such as sunspot number or the aa index a geomagnetic index defined by Mayaud (1972) which can be determined from magnetograph readings taken since the mid-19th century.
In Fig 3, we plot the annual means of the global low cloud cover against three different indices linked to solar activity; namely the aa index, the Zurich sunspot number and the cosmic ray flux, for the ten complete years covered by the cloud data: 1984-1993. The correlation coefficients between these three activity indices and the low-cloud factor are -0.82, -0.89 and 0.87 respectively, leading to a probability of occurrence by chance less than 0.2% for all three.
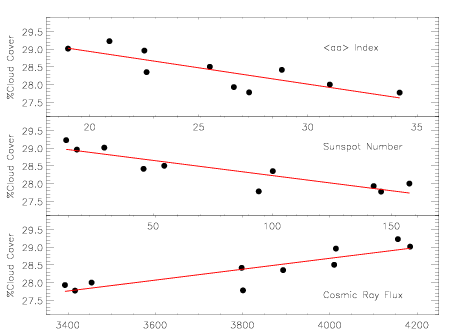
Figure 3
Regression of the annual means of the low cloud cover over the whole Earth and the {\em aa} Index (top panel), the Zurich Sunspot Number (middle panel) and the Climax Cosmic Ray Flux (bottom panel), for the period 1984-1993. The aa index is given in gammas and corresponds to the geomagnetic activity level at an invariant magnetic latitude of 50 degs. The cosmic ray flux is the scaled count rate per hour.
Estimating cloud forcing
The role of clouds in climate is still not well understood; they have two opposite effects. On the one hand they tend to cool the climate by reflecting short-wave solar radiation back to space, and on the other to warm the climate by trapping the long-wave radiation emitted from the Earth’s surface. The balance of these two effects is in part determined by the cloud height; on average low clouds are believed to cool and high clouds to warm the climate (Ockert-Bell and Hartmann, 1992; Ramanathan et al. 1989). Provided the above correlation is maintained over long periods, reduced low-cloud factor would be expected during high solar activity, and the increased solar activity in recent decades would translate into a global decrease in the low, cooling clouds thereby contributing to global warming.
In Fig 4 we show the mean annual low cloud cover inferred from the regression lines in Fig 3 applied to the same activity indicators, for the period during which cosmic ray data is available (1953-1994). Also plotted are the observed values for 1983-1994, as measured by the ISCCP. The three curves agree reasonably well with the measured values, although the aa index has bigger residuals than the sunspot number or the cosmic ray flux. The only major disagreement occurs during the years around 1971, when the aa index has a delayed peak in its activity cycle, probably due to the fast solar wind and recurrent geomagnetic storms produced by near-equatorial coronal holes during the descending phase of the solar cycles.
The anticorrelation between sunspot number and cosmic ray flux is well known, and during the approximately 50 years in which cosmic rays have been measured, they differ only slightly in the phase of sunspot maximum and cosmic ray minimum. No overall trend is observed in the period for which cosmic ray flux has been measured by neutron counters, however there are strong indications of long-term variability (Feynman and Ruzmaikin, 1999). To extrapolate further back in time when no directly measured cosmic ray fluxes are available, we are forced to use proxy indices such as the sunspot number or geomagnetic index. The geomagnetic index aa, in addition to its modulation during the approximately 11-years sunspot cycle, has a gradually increasing base level since the middle of the 19th century when systematic records began. This would imply that the levels of cosmic ray flux maxima have correspondingly decreased since the 19th century (see Feynman and Ruzmaikin, 1999). Over the long term, provided the correlation with low-level cloud holds up over such long intervals, the inferred lower maxima in cosmic rays would lead to reduced low-cloud factors and a reduced Earth albedo in recent decades compared to the 19th century which would have contributed to the current global warming. In Fig 5, we show the derived low-cloud factor over recent centuries using the regression lines in Fig 3. An increased low-cloud factor of about 1% is derived from the aa index for the late 19th century as compared to current levels. The sunspot number, on the other hand, has no long-term drift in zero point (i.e. it returns to zero at each minimum) and therefore does not predict such a large long-term change in low cloud factor.
Over even longer periods, we are forced to resort to indices based on isotope abundance, such as C-14 in tree rings and Be-10 in ice cores. In Fig 5 we show the inferred change in low-cloud factor from the Heliocentric Potential, an interplanetary magnetic field index calculated by O’Brien (1979) which is based on a combination of carbon isotope concentration in tree-rings, the aa index and cosmic ray flux. This index suggests a significant increase in low-cloud factor during the Maunder Minimum (1645-1715), leading to an increased albedo for Earth and a cooler climate during this time.
It is worthwhile noticing that at epochs of sunspot maxima, solar irradiance is enhanced and the low cloud cover is reduced together with the Earth’s albedo. The opposite effect occurs at sunspot minima. Thus, the low cloud albedo change, and the increase in solar irradiance which accompanies increasing solar activity, both operate to warm the climate and the respective radiative forcing contributions are compounded.
To estimate the net radiative forcing introduced by a change in the low cloud cover over the past century we have used the regression coefficients previously calculated for ISCCP cloud types (Ockert-Bell and Hartmann, 1992). Our calculations are subject to several assumptions, including: (1) the correlation between low cloud and cosmic ray flux is maintained over long time scales; (2) other cloud types remain constant; (3) that there is no additional change in the cloud factor from global warming, i.e. no feedback; (4) that the equations relating the changes in albedo, incoming and outgoing radiation determined from the C2 ISCCP dataset are equally valid for the D2 dataset since the cloud type definitions are closely similar (Rossow et al, 1996). It must be admitted that these assumptions are open to question. For instance, one may well expect humidity levels over oceans to increase as sea-surface temperatures rise, which could lead to increased cloudiness. There is some evidence for this, both in tropical regions (Wentz and Scahbel, 2000) and over the NE boundary of the Atlantic Ocean (Palle and Butler, 2000). However, such feedback scenarios would lead us into the more complex field of computer modelling of climate and lie beyond the scope of the present paper.
The forcing computed depends on whether we use the regression of low cloud factor on sunspot number, aa index or Heliocentric Potential to estimate the low cloud factor in 1900. From the regression lines determined earlier for these three activity parameters and a climate sensitivity to forcing of 0.53 degree C/W*m2 as used by Soon et al. (1996) (The value for climate sensitivity used by Soon et al. (1996) lies roughly midway in the range 0.3 – 1.0 degree C/W*m2 given by Lean and Rind (1998).), the inferred global temperature increase as a result of changes in low cloud, since the late 19th century, is 0.17 degree C from the sunspot number, 0.49 degree C from the aa index and 0.27 degree C from the Heliocentric Potential. This compares with a predicted increase in global temperature of 0.18 degree C due to a postulated increase of 0.14% in solar irradiance over the same period (Soon et al. 1996; Lean and Rind, 1998). Thus, the total global temperature rise derived from the combined effects of an irradiance increase and a decrease in low cloud factor over the past century is 0.35, 0.67 or 0.45 degree C, depending on which of the three activity indices are employed. The mean value 0.49 degree C is close to the observed increase in global temperature 0.55 degree C since 1900 (Lean and Rind, 1998; Jones and Briffa, 1992). Thus we find that, subject to the above assumptions, most of the global warming over the past century can be accounted for by the combined direct (solar irradiance) and indirect (cosmic ray induced cloudiness) effects of solar activity without the need for any artificial amplification factor.
Similarly, we can compute from the change in C-14 levels, (via the Heliocentric Potential), the effect of activity induced cloudiness on temperatures in the late 17th and early 18th centuries during the Maunder Minimum. We derive a cloud induced global cooling of 0.5 degree C during this period compared to modern temperatures. This together with a cooling of 0.32 degree C from an inferred reduced solar irradiance of ~0.25% at that time (Rind and Overpeck, 1993) implies a combined cooling of 0.82 degree C, reasonably close to the value of ~1.0 degree C believed to have occurred at this time.
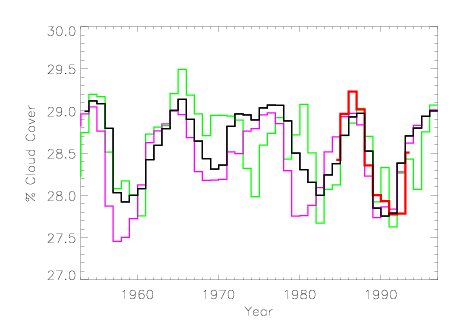
Figure 4
The measured low cloud cover factor over the whole Earth for the period 1984-1994 (thick red line). Also plotted are the reconstructed low cloud cover factors for the whole Earth derived from: the cosmic ray flux (black line), the Sunspot number (magenta line) and the aa index (green line).
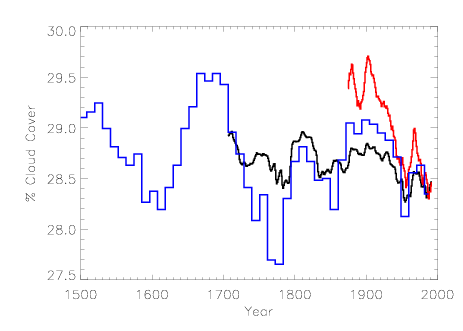
Figure 5
The 11-year smoothed reconstructed cloud cover for the whole Earth derived from the Zurich Sunspot number (black line) and the aa index (red line). In addition we plot the reconstructed cloud cover factor for the whole Earth derived from the 11-year mean Heliocentric potential (blue line).
Discussion and conclusions
We have reviewed the evidence for a correlation between cloud factor and the flux of galactic cosmic rays using the latest available cloud data from the ISCCP. Though our results confirm the findings of Svensmark and Friis-Christensen (1997) for the interval 1983-91 in the correlation of total cloud cover over the extra-tropical oceans and cosmic rays, this breaks down in the period 1992-94. Taking advantage of the superior classification of cloud types in the latest ISCCP D2 product we were able to assess the correlation with cosmic rays of cloud at three levels, low, medium and high, independently. Only for the low cloud was there any significant correlation with cosmic ray flux, but this appears to be widespread across the globe with a significant degree of correlation globally, in the tropics and in mid-latitudes, particularly over the oceans.
The correlation of low cloud factor and cosmic ray flux is unexpected as the maximum degree of ionization by cosmic rays occurs in the altitude range 12-15km, i.e. close to or above the tropopause. The altitude ranges covered by clouds of different type are: 0-3.2 km for the low clouds, 3.2-6.5 km for the mid-level clouds and 6.5-16 km for the high clouds. Thus any cosmic ray induced cloud effect would be expected to be stronger for high rather than low cloud layers (Kernthaler et al. 1999; Jorgensen and Hansen, 2000). An explanation may lie in the fact that, as the neutron detectors are located at ground level, the measured flux is more representative of lower than higher regions of the atmosphere. Also, we suspect that the physical state of the cloud droplets may play a significant role in the cosmic ray-cloud interaction. It has been pointed out before that the physics of ice and liquid clouds may differ (Gierens and Ponater, 1999). By analysing different low cloud types separately we found that clouds in a liquid phase account for almost all the variability during the observed period, leaving the ice clouds constant in time, except at the poles where a slight increasing trend for some of the ice cloud types is found. Thus the greater sensitivity of low cloud to cosmic rays may result from the preponderance of liquid phase cloud types at lower altitudes (less than 6-7 km).
The lack of correlation between cosmic rays and low cloud factor over the poles and the significant degree of correlation in the tropics, is also unexpected, as the cut-off of the lower energy cosmic rays by the geomagnetic field operates to severely reduce the cosmic ray flux over low latitude regions. Thus one could expect cosmic ray induced cloud to be more prevalent at the poles than low latitudes. Indeed Pudovkin and Veretenenko (1995), reported such a latitude dependence in clouds they believed to be associated with Forbush Decreases in cosmic ray flux. However, no such variation with latitude is apparent in our study. Again the explanation may lie in the different physical state of the cloud droplets over the polar and equatorial regions with ice clouds over polar regions less affected by cosmic rays than liquid cloud droplets over the tropics.
From our regression of low cloud factors with various solar activity related parameters, we have estimated the percentage change in cloud factor implied by the known variation in cosmic ray flux and solar activity during the past century. In addition, we have used cloud forcing factors derived by others to estimate the effect of cosmic ray-induced low cloud factor changes on global temperatures. Taken at face value, our results imply that, possibly excluding the last decade or so when an accentuated rise in global temperatures is widely accepted to have occurred as a result of the enhanced greenhouse effect, most of the global warming of the twentieth century can be quantitatively explained by the combined direct (irradiance) and indirect (cosmic ray induced low cloud) effects of solar activity. Similarly, we find the lower level of solar activity in the Maunder Minimum predicts an increase in the low cloud factor that gives rise to an increased albedo for the Earth and lower global temperatures.
However, a number of assumptions have been made, which if proved wrong would invalidate these estimates. In particular, we have ignored cloudiness changes due to other causes as well as those that could arise from feedback in the system. This latter assumption is particularly prone to criticism in view of recent evidence for changes in humidity (and probably cloud factor) over oceans from an increase in sea-surface temperatures associated with global warming.
We have not discussed the physical processes which may be involved in the modulation of cloud factors by galactic cosmic rays as these lie beyond the scope of the present paper which is primarily concerned with empirical data. Work by Tinsley and collaborators (e.g. Tinsley et al. 1989, Tinsley and Deen, 1991 and Tinsley, 1996) has explored various possible effects on cloud formation and precipitation processes of ionisation by both galactic cosmic rays and energetic particles of solar origin.
Acknowledgements
The cloud D2 datasets were obtained from the NASA Langley Research Center EOSDIS Distributed Active Archive Center. Also we would like to thank Dr. K. O’Brien, Dr. B. Bromage and Dr. G. McCormak for discussions and M. Murphy for assistance with computing. Research at Armagh Observatory is grant-aided by the Department of Culture, Arts and Leisure for Northern Ireland.
References
Feynman, J., Ruzmaikin, A., 1999. Modulation of cosmic ray precipitation related to climate. Geophysical Research Letters 26, 2057-60.
Gierens, K., Ponater, M., 1999. Comment on `Variations of cosmic ray flux and global cloud coverage – a missing link in solar-climate relationship’ by H. Svensmark and E.Friis-Christensen. (Rapid communication). J. Atmos. Solar-Terrest. Phys. 61, 795.
Haigh, J.,1996. The impact of solar variability on climate. Science 272, 981-984.
Jones, P.D., Briffa, K.R., 1992. Global surface air temperature variations during the twentieth century: Part 1, spatial, temporal and seasonal details. The Holocene 2, 165-179.
Jorgensen, T.S., Hansen, A.W., 2000. Comments on variation of cosmic ray flux and global cloud coverage. A missing link in solar-climate relationships. J. Atmos. Solar-Terrest. Phys. 62, 73-77.
Kelly, P.M., Wigley, T.M.L., 1992. Solar cycle length, greenhouse forcing and global climate change. Nature 360, 328-330.
Kernthaler, S.C., Toumi, R., Haigh, J.D., 1999. Some doubts concerning a link between cosmic ray fluxes and global cloudiness. Geophysical Research Letters {\bf 26, 863-865.
Lean, J., Rind, D., 1998. Climate forcing by changing solar radiation. Journal of Climate 11, 3069-3094.
Lean, J., Rind, D., 1995. Solar irradiance and climate change since 1610. Geophysical Research Letters 22 (23), 3195-3198.
Lockwood, M., Stamper, R., 1999. Long-term drift of the coronal source magnetic flux and the total solar irradiance. Geophysical Research Letters 26 (16), 2461-2464.
Mayaud, P.N., 1972. The $$ indices. J. Geophy. Res. 77, 6870-6875.
O’Brien, K., 1979. Secular variations in the production of cosmogenic isotopes in the Earth’s atmosphere. J. Geophys. Res. 84, 423.
Ockert-Bell, M.E., Hartmann, D.L., 1992. The effect of cloud type on Earth’s energy balance: Results for selected regions. Journal of Climate 5, 1157-1171.
Pudovkin, M.I., Veretenenko, S.V., 1995. Cloudiness decreases associated with Forbush-decreases of galactic cosmic rays. J. Geophy. Res. 57, 1349-1355.
Ramanathan, V., Cess, R.D., Harrison, E.F., Minnis, P., Barkstrom, B.R., Ahmad, E., Hartmann, D., 1989. Cloud-radiative forcing and climate. Results from the Earth Radiation Budget Experiment. Science 243, 52.
Rind, D., Overpeck, J., 1993. Hypothesised causes of decade-to-century climate variability: Climate model results. Quat. Sci. Rev. 12, 357-374.
Rossow, W.B., Walker, A.W., Beuschel, D.E., Roiter, M.D.,1996. 1996: International Satellite Cloud Climatology Project (ISCCP) Documentation of New Cloud Datasets. WMO/TD-No. 737, World Meteorological Organization.
Shindell, D., Rind, D., Balachandran, N., Lean, J., Lonegar, P., 1999. Solar cycle variability, ozone and climate. Science 284, 305-308.
Soon, W.H., Posmentier, E.S., Baliunas, S.L., 1996. Inference of Solar Irradiance variability from terrestrial temperature changes, 1880-1993: An astrophysical application of the Sun-Climate connection. Astrophysical Journal 472, 891-902.
Svensmark, H., Friis-Christensen, E., 1997. Variations of Cosmic Ray Flux and global cloud coverage. A missing link in solar-climate relationships. J. Atmos. Solar-Terrest. Phys. 59, 1225-1232.
Svensmark, H., 1998. Influence of cosmic rays on Earth’s climate. Phys. Rev.Lett. 81, 5027-5030.
Wentz, F.J., Schabel, M., 2000. Precises climate monitoring using complementary satellite data sets. Nature 403, 414-416.
More From SolarStorms.org:
 Cosmic Rays Received
- What’s Driving Climate Change in the 20th Century – Changes in Solar Radiation or the Buildup of Greenhouse Gases?
- Space Weather & Climate Change Trends
- Global Warming: The Balance of Evidence and Its Policy Implications
- Pacemakers
- Unusual activity of the Sun during recent decades compared to the previous 11,000 years
- The Maunder Minimum and Climate Change: Have Historical Records Aided Current Research?


Submit your review | |