“Two significant flares occurred during August 20-21 as a historically active sunspot group returned to the visible face of the sun. The geomagnetic field was disturbed through August 20. The source of the disturbance was a high-speed solar wind stream that originated from a coronal hole on the sun’s surface. Spacecraft sensors detected solar wind speeds approaching two million miles per hour. There’s a chance for more significant solar flares from the sunspot group during August 25-31 as it continues to trek across the visible face of the sun” [NOAA/SEC Outlook 99-20, August 24, 1999
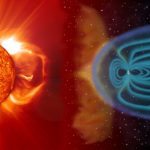
When CMEs do make it to the Earth, the compressed magnetic fields and plasma in their leading edges smash into the geomagnetic field like a battering ram. Across a million mile-wide wall of plasma, the CME pummels the geomagnetic field. Such niceties as whether the polarities are opposed or not, make little difference to the outcome. The CME pressure can push the geomagnetic field so that it lays-bare the orbits of geosynchronous communication satellites, exposing them to wave after wave of energetic particles. When the fields are opposed, particles from the CME wall invade the geospace environment, amplify ring currents, and generally cause considerable electromagnetic bedlam often tracked by increases in the recorded satellite anomalies and power grid GICs. Clearly, we need more advanced warning for solar flares, geomagnetic storms, and CMEs. A successful forecast of how severe a particular solar cycle will be, no matter how accurate, is simply not much more than a statement that ‘This winter will be more severe than last year’. This isn’t enough information to prepare us for tomorrow’s snowstorm, so is there any way of doing better than just predicting the ups and downs of the next solar cycle? Is there any way we can get the jump on individual day-to-day solar storms and space weather events? With some effort, the answer is, luckily, ‘Yes’, but like a Trojan Horse there are actually three kinds of forecasting issues tucked away within this one single operation. You can attempt to predict a space weather event before it starts. You can try to predict what it will look like when it is enroute to Earth. Or you can predict what it will do when it arrives.
If we can watch the Sun, we can gauge when a CME will come our way and have two or three days advanced warning. For solar flares, on the other hand, there is still a lot of work to do to provide more than a 10-30 minute warning, and we still can’t predict just how powerful the flare will be. This means, for astronauts, that every flare sighting requires running for cover as if your life depended on it.
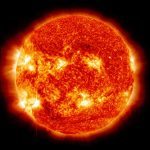
Once solar physicists had studied solar flares for a long-enough time, they began to develop a scale for ranking their magnitude much the same way that geologists use the Richter Scale to measure the impact of earthquakes. There are actually two magnitude scales in use at the present time. The oldest scale measures how much brighter the flare’s X-ray energy is than the average brightness of the Sun’s surface. This scale is actually rather fluid during the sunspot cycle. During sunspot minimum, the X-ray brightness of the Sun is low so a flare of a given brightness can be quite spectacular like a flashlight in a dark cave. But during sunspot maximum when the Sun is far brighter as an X-ray source, this same flare is nearly invisible like a flashlight switched-on in broad daylight. There are four main classes, B, C, M and X, and each is broken into 10 numerical sub-categories: 0-9. Like the Richter Scale used in earthquakes, an M5.5-class flare is 10 times more powerful than a C5.5-class flare, and 1/10 as powerful as an X5.5-class flare relative to the brightness of the solar surface.
The second scale, recently adopted by NOAA for its space weather alerts, ranks flares on the basis of their energetic particle flows measured at the Earth. A S2 flare has 10 times the particle flow as an S1 flare, but now the classification of the flare is based on the actual number of particles, not a relative number as for the B, C, M and X-classes.
Big Bear Solar Observatory is a telescope located on a spit of land in the middle of a lake in Southern California. Unlike most observatories perched high up on mountaintops, this one was placed on a lake because of the peculiar stability and clarity of the solar images that result from the combination of geographic circumstances. Air turbulence is normally the biggest factor preventing astronomers from seeing small details on the Sun. At Big Bear Lake, the air flows are parallel to the water and help to reduce the amount of turbulence near the telescope. Harold Zirin and William Marquette have spent years perfecting their BearAlert Program for spotting solar flares before they hatch. Armed with real-time solar data, they watch the minute-to-minute changes in an active region traced by its magnetic field and hydrogen emission. As a public test of their methods, over the course of a two-year period, they issued 32 ‘BearAlerts’ for sizable flares via email, and scored hits on 15 of them. Because solar conditions generally do not include flares, and because the Sun’s state changes only very slowly from day to day, it is possible to issue a ‘no flare today’ warning and be correct 9 times out of 10. This promising score is, of course, useless for anticipating whether a flare will actually happen or not. BearAlerts, and the space weather reports they have evolved into, are issued only when a flare seems to be about to happen. They are the closest things we have today to keeping ahead of these unpredictable solar storms.
Weather forecasters can usually tell you whether a particular storm has what it takes to unleash lightning discharges over your city during a given 2-6 hour period, but that is their limit. In a similar vein, solar physicists are fast approaching the capacity of announcing that a given active region will spawn solar flare activity during a set six-day period but, ironically, can’t tell you if one will happen in the next few hours. Like weather forecasters, they can’t tell you whether you will get a few major flares that could affect astronaut health, or a hail of minor flares that, individually, are unimportant.
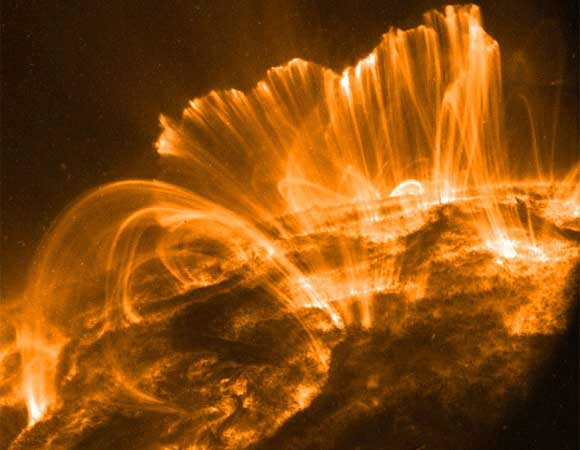
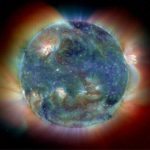
The next element of space weather is the solar wind itself, which acts like something of a conveyor belt, connecting the surface of the Sun and activity there, with the Earth. After the spectroheliograph was invented in the 1890’s, astronomers quickly got an eyeful of fiery prominences and other phenomena, busily hurling matter into the space surrounding the Sun. But no one really appreciated just how far this star stuff could travel until clues to its invisible journey began to show up in the direction that comet tails pointed, and in direct spacecraft observations in the early 1960’s. It travels at speeds of about a million miles an hour, and has a density of about one to five particles per cubic inch; mostly electrons and protons. In fact, it’s a better vacuum by far, than what scientists can make in their laboratories. What makes this wind disproportionately complex compared to the breezes you feel on a summer’s day is that it carries a magnetic field with it.
When two magnetic systems interact, the outcome depends on whether the polarities are the same or are different. During the Northern Hemisphere Summer, the north geomagnetic pole leans into the wind on the daytime side where its ‘south-type’ magnetic polarity of the Earth can bare the brunt of the effects. In the Northern Hemisphere Winter, the south geomagnetic pole leans into the wind on the daytime side, and it is the ‘north-type’ polarity of this region that determines how the dynamics will play themselves out. If the wind and geomagnetic polarities are the same on the daytime side, very little happens as the solar wind streams past the Earth. The magnetic pressure of the wind pushes gently on the magnetic field of the Earth like water giving way to a passing boat. But, if the polarities are opposite, north and south-type magnetic field lines rage a pitched, but futile, battle to unkink themselves into a smooth geometric shape. As a result, the magnetosphere picks up energy from the currents of particles that are created, and the geomagnetic field becomes wildly unstable in its outer frontiers: the Magnetopause. This triggers hours-long geomagnetic storms, and spectacular aurora, as currents of accelerated particles flow from distant unstable regions in the dynamic geotail, and into the atmosphere along the field lines. Because the origin of these magnetic storms involves the invisible solar wind whose roots in the solar surface cannot be detected, they seem utterly random and unrelated to specific sunspot groups. We never see them coming. As the wind constantly changes its strength and polarity, the geomagnetic field responds with minor magnetic irregularities called ‘sub-storms’. Many sub-storms are strong enough to cause aurora to appear in extreme northern and southern latitudes. Even comet tails develop kinks and irregularities that follow the clumpy, and gusting, solar wind.
About one million miles from the Earth, in the general direction of the Sun, a group of NASA satellites serve as our outposts on the solar wind at the L1 Lagrange Point. The L1 region is an invisible dimple in the gravitational well of the rotating Earth-Sun system. You could fly right through it and not realize anything unusual was going on. Satellites carefully positioned there, like a pencil balanced on its point, may orbit this invisible point in space lacking any gravitating matter to hold them to this spot. From this vantage point, SOHO busily watches the solar surface and relays its images back to Earth. The ACE and WIND satellites, meanwhile, sample the magnetic field and composition of the solar wind as the wind rushes by. Like buoys bobbing in the ocean off coast, these satellites tell us of changes in the wind conditions that can signal trouble for the geomagnetic field within 45 minutes.
In addition to solar flares and the solar wind, the coronal mass ejections (CMEs), first seen by the OSO-7 satellite and by Skylab in 1973, have been studied in detail, and nearly all of them vouch for a serious consequence should one find its way to the Earth. Soon after being launched by the Sun, in an event that often engulfs nearly the entire solar disk, they are accelerated to speeds from a gentle 10 km/sec to over 1500 km/sec; nearly 2 million miles per hour. Within a few days, they can make the journey from the Sun to Earth orbit, and can carry up to 50 billion tons of plasma.
The launch of the SOHO satellite in 1995 put the Sun under a 24-hour weather watch. One of the most spectacular instruments on this satellite was LASCO, the ‘Large Area Solar Coronal Observatory’. Like its predecessors on OSO-7 and Skylab, it was a coronograph, which manufactured artificial total solar eclipses so that the faint details in the corona could be studied. No sooner had the shutter opened on this instrument, when it began to record vivid images of CMEs leaving the Sun. Within a year, SOHO scientists became adept in using LASCO to anticipate when the Earth would be affected by these disturbances. Eventually, NOAA’s Space Environment Center, whose responsibility was to produce daily space weather forecasts, began to use the LASCO data in 1996 to improve their accuracy. By keeping an eye out for ‘halo’ CME events which were directly aimed at the Earth, it was now a routine matter to achieve a 2-3 day advanced warning at least for onset of major geomagnetic storms that could cause satellite outages and electrical power blackouts. So long as the SOHO satellite keeps working, it substantially improves our chances of never being caught off-guard the way we were during the Quebec 1989 blackout.
Although solar flares are often seen near the birthplaces of CMEs, solar physicists don’t believe they are what actually cause them. CMEs and flares both track still more subtle, underlying conditions that is the mother to them both. Flares actually happen at much lower altitudes in the Sun than where the CME plasmas are spawned. Solar physicist Richard Canfield and his colleagues at the University of Montana, have spent some time trying to get the jump on CMEs even before SOHO’s instruments can start to pick them up. They think they have found what is triggering at least the major ones that we have to worry about back home. To see the birth of a CME, you can’t use ground-based data at all. You have to use X-ray images of the Sun taken by satellites such as the Japanese-US-British, Yohkoh X-ray observatory.
A major press briefing at NASA Headquarters on March 9, 1999 soon got the news media’s attention, and The Washington Post carried a headline “Scientists Find Way to Predict Solar Storms’, while ABC News offered ‘The Sun’s Loaded Gun: S-shapes on Surface Foretell Massive Solar Bursts”. The idea that these S-shaped ‘sigmoid’ fields were like a cocked gun ready to fire became the inevitable centerpiece sound-byte in many of the reports. During sunspot minimum, about one CME can be produced each day or so. During sunspot maximum, the Sun can spawn a handful of them in a single day. Fortunately, most of these are ejected either on the opposite side of the Sun from the Earth, or at large angles from the Earth so that they miss us about nine times out of ten. When CMEs flare toward the Earth, ‘Great Aurora’ bloom across the globe, and geomagnetic conditions become dramatically turbulent for days as the great wall of plasma rushes by.
“Strong geomagnetic storm conditions are in progress. These levels of activity are possibly the result of a shock observed in the solar wind on October 21 at 01:38 UT originating from a coronal mass ejection on the sun on October 18. This level of disturbance routinely causes power grid fluctuations, increased atmospheric drag, and surface charging on satellites, intermittent navigation system problems, signal fade of high-frequency radio signals, and auroral displays at mid-latitudes” [NOAA/SEC Advisory 99-9, October 22, 1999]
The geomagnetic field and its collections of trapped particles, is the last stop for most of the severe space weather events spawned by the Sun. Just as your local weather reporter can tell you about rainfall, temperature, humidity and pressure as presages for tomorrow’s forecast, space weather can also be charted by keeping track of a handful of numbers. Over the years, scientists devised a number of quantities that gave a quick reading to the level of geomagnetic storminess. Few have turned out to be as popular as the ‘Kp’ index devised in 1932 by Julius Bartels. Next to counting sunspots as a barometer of solar activity, the Kp index brings a second dimension to the problem of forecasting: Sunspot numbers define how active the Sun is, while Kp tells how vigorous the Earth’s response was to solar activity.
Kp is an average measure of the largest swings in magnetic activity that you record around the globe during any three-hour period. It’s not a number on a linear scale like temperature, instead it’s a part of a logarithmic scale like the Richter Scale, which is used to gauge earthquakes. A 9.3 geomagnetic storm, for example, is 100 times more powerful than a 7.3 storm. Typically, on any given day, the Earth’s field imperceptibly bumps and grinds at Kp levels between 1.0 and 3.0. With a magnetic compass in hand, you would not even know there was a problem at all. These seemingly random gyrations define the normal quiet state of the planetary field, but occasionally it can belt-out a disturbance you need to pay attention to. Kp values between 4.5 and 5.5 are classified as Small Storms like the occasional, harmless, earthquakes seismologists detect every few weeks in the San Francisco Bay Area. Large storms require Kp values between 5.6 and 7.5, and these are like the yearly shakes that California residents feel that cause the dishes to rattle and the chandelier to swing. Finally you get to the Major ‘head for the hills’ Storms require Kp indices greater than 7.5 and resemble the once-in-a-decade Loma Prieta or 1999 Turkey earthquakes. They are the ones that can cause blackouts. Luckily, geomagnetic storms have to be pretty large ones before anyone has to seriously worry about what impacts they will have. Only storms with Kp indices greater than about 6.0 seem to have what it takes to shake-up electrical systems. On this scale, the Quebec blackout was a 9.3 “mega storm”. There have only been three other ones like it in the last 50 years: in 1940, 1958 and 1989. With that said, space scientists cannot tell you when the next one will happen. One thing is for certain based on previous patterns; the odds are very high that there may be less than a few minutes warning that the storm will escalate to this level of severity – not enough time for a utility company to do much more than watch, and hope for the best. By the time you are forced to use Kp to decide what to do, it is already too late to decide what to do.
So, after 100 years of effort, space physicists now have begun to understand some of the basic rules of space weather forecasting. They know how to measure a set of parameters that track space weather severity. They have at their disposal, real-time images of the solar surface and it’s surroundings. There are many parallels with ordinary weather forecasting, too. Like modern weather forecasters watching a hurricane develop, they can track CMEs as the leave the Sun, but they lose sight of them almost immediately as they enter interplanetary space. Just as hurricane watchers on a beach can see an incoming storm hours before it arrives, satellite sentinels at the L1 Lagrange Point can anticipate a CME shorefall on Earth within the hour. Solar physicists can anticipate when a solar region may disgorge a flare, but like weather forecasters, they cannot predict the times of individual lightning strikes.
The main problem that opposes the further development of newer space weather forecasting techniques is that the data is too sparse to follow all of the changes that can have adverse impacts. Research satellites are launched and put into service on the basis of scientific needs, not on the basis of their utility to space weather forecasting. Even if we had a fully working armada of satellites keeping a watch on the entire system, this would still not be sufficient to provide detailed forecasts. Some method has to be found for filling-in the data gaps, and that method involves the detailed physical modeling of the system and all of its various interactions.
In ordinary weather forecasting, scientists have thousands of stations throughout the globe that report local temperature, pressure, humidity, wind speed, and rainfall. Weather balloons and rockets, as well as satellite sensors measure changes in wind speed and pressure across great swaths of vertical space from the ground and into the tropopause. Every minute or hour, a ‘state of the atmosphere’ survey can be made to poll how things are going. To make a forecast about tomorrow’s weather, you plug this data into a sophisticated 3-dimensional model, which extrapolates the current conditions into the future, one small computation step at a time. It’s called the General Circulation Model, and it’s the product of a century’s work in the scientific study of the atmosphere using the tools of classical mechanics and the behavior of gases and fluids. When you mix these theoretical ingredients together with the data on a rotating, spherical surface heated by the Sun, and connected to the oceans and land masses, the resulting atmospheric model helps the National Weather Service generate forecasts good enough to make the average person happy. The one-hour forecast is usually bang-on correct. The 24-hour forecast is now routinely accurate for perhaps 95 attempts out of 100. The three-day forecast is usually good to about 70 attempts out of 100, unless you live in Boston – where nothing works. Even the seven-day forecast is better than the toss of a dice in many localities. Weather forecasts are also more accurate the larger the area they apply to. For instance, you may not be able to predict the rainfall in Adams, Massachusetts next Wednesday, but you can tell if El Nino will make the entire East Coast of North America warmer or cooler by two degrees. With long-term climate models, you can even recover the global weather patterns for the spring of 769 AD
Now, suppose you only had a dozen weather stations across the globe, and every five or ten years you had to replace some of them at a cost of $150 million each. Suppose, too, that when you replace them you don’t put the new ones in the same locations, or equip them with the same instruments. You also don’t get to make the measurements at the same time. Then, added to this, suppose that your forecasting model is still under development because you don’t know what all of the components that affect your weather happen to be. You don’t know how clouds move from place to place, or how the sunlight actually heats the gas, or just what it is that causes rain to form in a cloud. Welcome to the complexities of space weather forecasting:
“Solar activity, between December 1-27, is expected to range from low to high levels. Frequent C-class flares are likely. Isolated M-class flares will be possible throughout the period. There are also chances for isolated major flares as potentially active regions 8765, 8766, and 8771 are due to return on December 7. There is a chance for a solar proton event at geosynchronous orbit when the above mentioned regions return starting on December 7. The greater than 2 MeV electron flux at geosynchronous altitude is expected to be at moderate to high levels during December 5-10 with normal to moderate levels during the remainder of the period. The geomagnetic field is expected to be at unsettled to minor storm levels during December 4-8 due to recurrent coronal hole effects. Otherwise, activity is expected to vary between quiet and unsettled levels barring any earth-directed coronal mass ejections” [NOAA/SEC Weekly Highlights and Forecasts, December 1, 1999 2112 UT]
By the 1980’s, solar and geospace research had made a number of significant refinements to the best of the theoretical models for how the space weather system functions; much of this was thanks to the advent of powerful supercomputers and new data from dozens of interplanetary observatories and spacecraft. Everyone could now afford their own ‘workstation’ that harnessed more computing power than most of the mainframe computers of the 1960’s era. What was dramatic about the new way for researchers to do business was that it was no longer necessary to take mathematical shortcuts that could compromise the accuracy of a theoretical prediction. Nearly-photographic renderings of complex fields, plasma flows and particle currents could be calculated, and compared to satellite data as it was taken along the satellite’s actual orbit. Theoretical investigations were now hot on the trail of being able to describe the detailed bumps and wiggles in satellite data, not just their overall shape. Because the calculations were based on ‘first principles’ in physical science, they were powerful numerical testing grounds of our knowledge of the space environment. Glaring deficits in understanding tended to show up like a black eye, impelling theorists to improve the mathematical models still further. The art of modeling space weather systems had matured to the point that the crude averages used in earlier AE and AP-8 models were no longer necessary or even desirable.
The next big challenge was to combine a number of separate mathematical models into one seamless, coherent, and self-consistent super-model. The National Weather Service had long enjoyed the benefits of a General Circulation Model to predict the course of a hurricane, or next Tuesday’s rainfall. What space weather forecasters needed was something very much like it. During the 1980’s, researchers independently worked on their own theoretical approaches to space weather phenomena, each describing a specific detail of the larger system. In the 1990’s, it was time to bring some of these pieces together. Here’s how it is meant work, at least in principle:
In the new scheme of things, a Solar Surface ‘module’ developed by one group of researchers would take a set of input conditions describing the solar surface, and calculate the surface magnetic conditions of the Sun along with the various plasma interactions and flows. This information would be passed on to a Solar Wind, or CME, Module developed by other groups, which would detail the transfer of matter and energy from the solar surface, all the way out to the Earth’s orbit. At this point, you would have a forecast of whether the Sun was going to send a CME towards Earth or not.
The output from this Solar Wind module would then feed a Geospace Physics module, which would calculate the detailed response of the Earth’s magnetosphere, ring currents and magnetotail conditions. Finally, there would be an Upper Atmosphere module that would take the output from the Geospace Physics module and calculate how the properties, currents, energy and composition of the Earth’s exosphere-ionosphere-mesosphere system would be modified.
Like a relay race in which a baton is passed from one research team to another, a disturbance on the Sun would be passed up the stack of modules until a specific consequence materialized in the geospace environment. Each of these steps would be updated in near-real time for a ‘Nowcast’, or jumped forward 5, 10, 48-hours to make extended forecasts based on the current conditions. At least this was the hope. In reality, although the individual parts to the ‘car’ were in-hand, there was no agency that could assemble all the parts. No single agency had the financial resources and scientific support to do it alone. The DoD might, for instance, have the best available model of the ionosphere; NSF might have supported research to develop the best available solar atmosphere model. The knowledge had to be shared and interconnected before it would be possible to make a meaningful forecast. This requires the cooperation of scientists working under many different kinds of grants, across a number of different federal and private agencies.
Even though space environment effects have been known for decades, space weather forecasting is nearly as much an art as a science. By some accounts, we are 40 years behind the National Weather Service in being able to detect or anticipate when a solar storm will actually impact the geospace environment. Meanwhile, the Weather Service has benefited from two critical developments during this same time frame. Powerful ‘physics-based’ programs have been created that run on supercomputers to track atmospheric disturbances from cradle to grave. This is possible because our theoretical understanding of what drives atmospheric disturbances has grown and deepened since 1950. The second factor is a functioning network of weather satellites, which actually watch the globe around the clock, and have done so almost continuously since the early 1960’s when Tiros was first placed in orbit. All of this atmospheric research and monitoring activity is supported by NOAA’s National Environmental Satellite, Data and Information Service which maintains a fleet of polar-orbiting and geosynchronous weather satellites to the tune of $368 million (FY 1997) a year. There is no comparable network of non-research satellites to keep track of space weather conditions.
Unlike terrestrial weather which, as they say in Boston changes every five minutes, the space environment is quite another matter. Only in the last five years have scientists been able to put in place a rag-tag collection of satellites capable of keeping constant, and simultaneous, watch on the solar surface, the solar wind, and its affects on the geospace environment. Although NASA has launched more than 60 research satellites since the early 1960’s, studies of the space environment are still regarded as low-profile activities compared to planetary exploration and probing the deep universe. The need for a specific satellite is weighed entirely on its scientific and technological returns to NASA and the space science community, not on any benefit to NOAA, or commercial and military space weather applications. This is an attitude very much different than for weather satellites such as the Tiros, GOES and NOAA series launched by NASA, but operated by NOAA. There are dozens of these applications satellites orbiting the Earth that are owned by non-NASA agencies like NOAA, the Department of the Interior, and the Department of Defense, compared to a handful of working research satellites.
As the 20th Century began to draw to a close nearly 40 years after the start of the Space Age, members of the space science community thought that it was a good time to start thinking about the big picture. So in 1993 they went ahead and contacted the National Science Foundation. In response, NSF organized a meeting of government, industry, and academic representatives to discuss what was going on in space weather research, and what kinds of things needed to be done. The Federal Coordinator for Meteorology was assigned the task of organizing this effort, which would take quite some effort to set in motion. It was pretty obvious, by then, that several decades of independent work by researchers in many agencies had, nevertheless, still left many things only partially completed in terms of a larger product such as a space weather forecasting model. Like tiling a floor, sometimes it is easier to work at the center of the floor than in the complex boundaries. But, some invisible threshold had been crossed, and everyone agreed that the new, National Space Weather Program (NSWP) would be worth the cost,
“The predominant driver of the program is the value of space weather forecasting services to the Nation. The accuracy, reliability, and timeliness of space weather specification and forecasting must become comparable to that of conventional weather forecasting.” [NSWP,1999]
NSWP would have to work with such diverse federal agencies as the National Oceanic and Atmospheric Administration (NOAA), NSF, the Department of Defense (DoD), and NASA; all having long, historical ties to different segments of the research community, and with their own needs for improved forecasting capability. The DoD, for example, has its own space weather service provided by the Air Force’s 50th Weather Squadron in Colorado Springs, Colorado. Their particular interest is how solar and geomagnetic storms affect the LORAN navigation system, Global Positioning System satellites, and other sensitive satellite real estate. They had one of the best ionosphere models in the world, but were understandably concerned about secrecy issues in just handing over the model’s computer code and operating theory to a non-DoD community.
To start the ball rolling, NSF and the DoD made $1.3 million available in 1996 to augment space weather research in several key areas, and promised to increase this amount each year. NSF added this new research directive to its Global Change Research Program through a new initiative called Geospace Environment Modeling. The outcome of this research would be a Geospace General Circulation Model, which would take solar wind conditions and forecast their consequences for the entire geospace region. A series of ‘campaigns’ begun in 1996, would support theoretical modeling grants for researchers to study the magnetotail region and how it causes substorms, and the inner magnetosphere with its ring currents. This sounds like a lot of money, but in reality, nearly half of the $1.3 million per year will disappear into various forms of institutional ‘overhead’ costs including phone bills, office space rental, and health benefits. Out of hundreds of space scientists, only a few dozen or so will be supported each year on this kind of a budget to do the Herculean job of building this mammoth space weather modeling system. But it was a far cry from no support at all! By FY 1999, this amount had increased to $2 million, and the NSF was hoping to use this to support 20-30 scientists at $50,000 to $100,000 per year, including overhead costs.
NASA already supported much of this activity through its Office of Space Science, which handles ‘Sun-Earth Connection’ research. NASA?s role in space science has by no means been inconsequential. Since 1958 it has built and launched over 60 solar and space physics research satellites at the behest of the space science community. With Congressional approval, NASA creates satellite programs such as Explorer, MIDEX, and SOHO, which pay teams of researchers to build the instruments and the satellites. NASA then launches these payloads. Afterwards, NASA provides all of the satellite tracking and data archiving services for the duration of the funded mission. Each mission has a budget for Mission Operations and Data Analysis (MO&DA) from which it supports its own investigators to work with satellite data. NASA also hires its own permanent staff of space scientists to support the archiving activities and provide modest enhancements to the format of the data so that the space science community can work with the data more efficiently. Ironically, NASA space scientists and mission scientists cannot apply to the National Science Foundation to support their research. NSF does not support space research using NASA resources. NSF considers any research involving space or satellite data something that NASA should support. NASA, meanwhile, rarely supports astronomers to carryout ground-based research involving telescopes. NASA ‘Civil Service’ scientists meanwhile can only conduct research that enhances the value of the satellite data. Although mission space scientists sometimes are offered permanent jobs with NASA when no hiring freezes are in effect, they usually return to academia or industry, and continue their research, sometimes by obtaining both NSF grants and NASA research grants.
Beginning in 1996, NASA?s Office of Space Science tried to set-up a Quantitative Magnetospheric Predictions Program that was supposed to result in a comprehensive magnetospheric model. The model would rely on solar wind data provided by its own research satellites such as WIND or ACE, and from this compute the consequences for the complete system. It was a promising and exciting new program, and a timely one to boot, but the idea was left dormant for several years and never became a funded NASA program. The message from Congress, and from NASA, to the scientific community was that NASA had already done its fare share of contributing to the National Space Weather Program just by providing the research community with satellites and data. Any work that NASA’s space scientists would do with the archived data would have to focus on providing ?value-added? information, but not to produce a major new product such as a new forecasting model. At the request of the non-NASA research community, NASA had put into place a virtual armada of solar and space physics research satellites, and NASA was very happy to supply non-NASA modelers with all the data they needed. After 40 years, there was a lot of data to go around.
At the NASA, Goddard Space Flight Center, Building 28 is tucked away in a not very well traveled part of the campus. Deer frequently come out on the front lawn to graze, and keep a wary eye out for passing scientists. The 1990’s vintage architecture hides a virtual rabbit’s warren of offices and cubicles, each with its own occupant hunched over a computer terminal or reading the latest journal. It is also the home of the National Space Science Data Center; a massive, electronic archive of all of the data obtained by NASA satellites since the early years of space exploration. 395 satellites have contributed 4,400 data sets and a staggering 15 terabytes of data which grows by 100 gigabytes each month. There are also 500,000 film images from the manned space program, and hundreds of movies and videos.
Sophisticated, interactive, programs such as the Consolidated Data Analysis Web (CDAWeb), let scientists extract specific measurements of dozens of different physical properties that define space weather conditions throughout the solar system. You can do this too, if you visit their Internet page! Would you like to see what the solar wind magnetic field was like on January 1, 2000? Enter the date, select the magnetic parameter, and in a few seconds you will get a plot of magnetic field directions from the ACE or WIND satellites. A little more of this data mining will quickly point out a problem. There are big gaps in the available data for a given parameter you are looking at, because satellites and their measuring instruments have not been flying at the same time to perform coordinated studies of specific phenomena. This lack of coordinated observations began to change in the early 1990’s with the International Solar-Terrestrial Program: ISTP.
This $2.5 billion program inaugurated in 1994, used the vast majority of this money to build four key satellites, and to support engineers and other ground crew to keep round-the-clock vigils on spacecraft functions and telemetry. The Solar and Heliospheric Observatory (SOHO) monitors the solar surface at optical and ultraviolet wavelengths to catch CMEs and to keep watch on active regions on the Sun. WIND measures the solar wind speed and magnetic field strength, at the L1 Lagrange Point inside the orbit of the Earth. Next in line is the Geotail satellite whose complex orbit lets it measure activity in magnetotail of the Earth, watching for changes that herald the onset of geomagnetic sub-storms. Lastly, the POLAR satellite looks at the Polar Regions of the Earth to keep watch on the changes in auroral activity.
In principle, this fleet of satellites can study the ‘cradle to grave’ growth of solar disturbances, and track them through a series of satellite hand-offs all the way from the solar surface to the auroral belt. The ISTP network has only been in place since 1996, which means that it hasn’t been ‘on the air’ long enough to examine a representative number of solar storm events. In fact, it started its campaign during sunspot minimum when not much was going on at all. With the planned budget cuts, and its $50 million annual operating budget, it is unlikely the ISTP network will be able to operate much beyond the peak of Cycle 23; a critical period for catching the Sun at its worst.
Since ISTP became operational, NASA has also provided an array of other satellites beyond the ISTP constellation as new technology and scientific interests arose. By 1998, the Sun, the wind from the Sun, and the geospace environment have been under around the clock surveillance by a newer generation of satellites. None of these missions, however, have a carte blanch to do more than a modest amount of research with their data before archiving it for posterity.
The Advanced Composition Experiment (ACE) satellite, launched in 1998, monitors the minute-to-minute changes in the solar wind magnetic field and composition. This $160 million mission, hopes to retain NASA funding until its steering gases run out in 2006. Despite the many, and growing, practical benefits of having this satellite operational until the end of Cycle 23, it faces stiff competition from other planned research satellite programs to continue operating beyond 2001. NASA, and the space community, is less interested in practical benefits from a satellite, than a steady stream of fundamental insights about space physics processes. The predecessor to ACE, called ISCE-3 launched in 1978, ran into similar difficulties. NOAA and DoD wanted this satellite to remain at L1 to continue providing real-time solar wind data for space weather forecasting. NASA, at the urging of its science advisory board, yanked it out of this location so that it could fly-by Comet Jacobi-Zimmer in 1983. The Air Force made it quite clear to NASA that ISCE-3 was needed for practical purposes, but NASA had to listen to the science community which sponsored the mission to ‘explore’ and do a pre-Halley’s comet flyby. ACE currently costs $5 million each year to maintain the satellite, and to fund research scientists to work with, and archive, the data. Again, NOAA and the Department of Defense, not wishing or being able to secure the funds themselves, rely on NASA to develop and launch satellites, like ACE, to help with their space weather forecasting.
The Transition Region and Coronal Explorer (TRACE) satellite, launched in 1998 uses high-resolution imaging to show the fine magnetic details on the solar surface which older satellites such as Yohkoh could not detect clearly. The promise of better advanced warning for CMEs, and especially for solar flares, will be realized by the crystal-clear images returned by this satellite of magnetic field structures on the solar surface. Even grade-school students will study these dramatic images to learn about solar magnetism. The $150 million mission will last until 2003, with no currently planned replacement to continue the exploration of the solar, magnetic ‘fine structure’.
The exciting prospect of actually imaging CMEs as they travel from the sun will become a reality in 2001 with the launch of the Solar Mass Ejection Imager (SMEI). This satellite, developed by the U.S. Air Force’s Battlespace Environment Division at the Air Force Research Laboratory, will measure sunlight scattered by electrons within the CME, and create movies of incoming CMEs. Extensive studies by Bernard Jackson, the University of California, San Diego co-Investigator on the SMEI mission, has already demonstrated how well this technique works using data from the HELIOS satellite in 1977, and radio-wavelength data from ground-based telescopes. As a forerunner to the next generation of CME imagers, it will almost completely take the guess work out of predicting which CMEs, out of the several thousand the Sun produces every sunspot cycle, will actually collide with the Earth.
Closer to home, the geospace environment will not be left out of this onrush of investigation. The $83 million Imager for Magnetosphere-to-Auroral Global Exploration (IMAGE), launched in February 2000 provides images of nearly the entire geospace region, to keep track of the movements of charged particles and their currents. Previous generations of satellites only measured the space weather conditions where they were specifically located. IMAGE delivers five-minute update images of the global pattern of plasmas, from the magnetopause all the way down to the auroral region. For the first time, space physicists can ‘see’ the flows and changes in these systems of particles, which previous satellites could only hint at. Its prime mission lasts two years, with a much hoped for extension until 2004 assuming that the space science community continues to see this satellite as actively contributing to magnetospheric research. What IMAGE scientists hope to learn from this is how high energy particles circulate and are stored, in the magnetosphere which will then tell space scientists about the latency of energetic particles. In practical terms, it may also illuminate how satellites such as Galaxy IV, DBS-1 and others, sometimes seem to run into trouble long after a space weather event has seemingly passed us by.
In the first decade of the 21st Century, a new series of NASA satellites such as STEREO, the Global Electrodynamics Connections, and the Magnetosphere Multi-Scale Mission will replace the current fleet. An ever-changing hat game will be continued as older satellites run out of fuel or funding, and have to be replaced by newer, more capable, satellites designed to explore new issues in the Sun-Earth system.
After the ISTP program disbands as its satellites, one by one, fall out of service from old age, what new program will take its place to coordinate another assault on the space weather issue? The current suite of satellites is mostly a series of independent efforts led by investigators studying specific issues, but there is only a rudimentary attempt at coordinating the observations. In some cases it is not possible to do this because, for example, a satellite like IMAGE may not live long enough to be on the scene when the STEREO satellites begin taking their data. IMAGE will rely on a, hopefully, one to two year overlap with SOHO and ACE to provide data on the external, interplanetary environment which sets in motion the geomagnetic events IMAGE hopes to investigate. But the key problem is that there is not enough research money outside the satellite operating budget to support scientists in making sense of what they observe. To make matters worse, over the years, the part of a mission’s budget which is set aside for research, MO&DA, often gets robbed during the construction of the satellite to cover cost over-runs. One solution is for NASA to create a program, with more available money to go around, to support both new satellites and enhanced MO&DA activities. In 1996, NASA attempted to create the Quantitative Magnetospheric Predictions Program, and ISTP. Although the former program did not survive as a new start, ISTP succeeded spectacularly, and provided a coordinated investigation of solar activity during the first half of Cycle 23. In 1999, NASA proposed another program to take over from ISTP, and to further coordinate space research activities.
“The ultimate output of this campaign would be the observational specifications for an operational space weather system and the models to apply to the data to produce accurate and reliable forecasts over the timescales required to be beneficial to humanity’s space endeavors” [NASA, SEC 2000 Roadmap, p. 96]
Every three years, federal agencies are required to develop strategic plans to serve as a basis for governmental policies and strategic planning. In January 2000, George Withbroe, the Director of NASA’s Office of Space Science, together with a team of 28 experts, produced a Sun-Earth Connections 2000 ‘Roadmap’. A significant factor in this document is the renewed emphasis placed on improving our space weather forecasting ability, and providing the satellite resources to keep a constant watch on the Sun through the year 2025. Withbroe’s new program, which he calls Living with a Star, is the embodiment of the new strategic plan, and will nearly double the $250 million spent on solar and geospace research each year by NASA. With the backing of his advisors from the space science community, he envisions a new suite of satellites to be built in the first decade of the New Millennium, which will take over from the aging ISTP program, and cover the next solar cycle: Number 24.
In August, 1999, following an unusually lengthy meeting with NASA’s Administrator, Daniel Goldin at NASA Headquarters, Goldin gave his go-ahead to Withbroe’s proposal to set-up such a new program, and since then Withbroe has been presenting his plan to the scientific community to galvanize support for it. Apparently, it wasn’t the detailed science or the heroic dreams of solar physicists that apparently caught Goldin’s attention. Instead it was an issue, in the post-Challenger NASA age, that has become a critical ingredient to every scientific program administered by NASA: Safety. Astronauts can, and will, be affected in a measurable way by radiation exposure. Even though the Occupation and Safety Administration and NASA have agreed upon the 60 rem per year annual limit for astronauts, in today’s radiation-adverse society, even this much (equal to thousands of chest X-rays) seems an unacceptable health risk. Some solar flares can do far worse than this dosage to a spacesuited astronaut. In a press release by the National Research Council issued on December 10, 1999, they also urged NASA to carefully monitor its astronauts for radiation exposure, and to support programs that will enhance our ability to forecast solar storms. Newspapers such as USA Today, carried the story, originally covered by the Associated Press, with the headline “Radiation Alert”,
“[The NRC] warned that astronauts might receive doses of radiation equal to several hundred chest X-rays from solar flares during planned space construction”.
Although Living with a Star is an exciting new program with profound impacts on space weather forecasting, it still has to meet the challenges of another, and even larger program, “Living with the Congress”. NASA may recommend a ‘new start’ program requiring a new ‘budget line’ to be opened in NASA’s annual budget, but it literally requires an Act of Congress to make it happen. Although we enter the New Millennium with over $200 billion in federal budget excesses each year, NASA’s own budgets are projected to be extremely flat for the foreseeable future, making it very difficult to shake-loose the money needed for a new program. Coming as it does as a new proposed expense for NASA during an election-year Congressional budget debate in the year 2000, the odds seem pretty slim that Living with a Star will reach ignition temperature. Nevertheless, a rumor has it that sometime in late-1998, while NASA was testifying before Congress, the issue of what NASA was doing about space weather came up in the questioning of NASA’s planned FY1999 budget. If true, this could be a watershed moment for the future of this entire enterprise at NASA, and a promising sign that its time has, at last, arrived.
“Solar storms are dramatic changes in our solar system that are the result of solar activity. The ground doesn’t shake, and the sky does not turn black when a solar storm strikes the Earth…Because solar storms attack the very foundation of our high-tech society, scientists are excited to find that satellite data will help them predict solar storms and mitigate their impact on Earth” [‘Our Sun:A Look Under the Hood”, NASA Facts]
More than just another NASA program that will benefit NASA and the academic space science community, one of the major beneficiaries of this new program will be the Space Environment Center in Boulder Colorado. This will happen just as the US Weather Service benefited from the atmospheric research spurred-on by the new satellite data provided by NASA in the 1960’s. The mission of the SEC is to conduct research on solar-terrestrial physics, develop techniques for forecasting geophysical disturbances, and provide real-time monitoring of solar and geophysical events. The 55 employees that work there under a $5 million annual budget, issue daily forecasts to a long, and in many cases confidential, list of clients including the US military and commercial satellite owners. Whether you are a Global Positioning System (GPS) user, a geologist prospecting for minerals, or even a pigeon racer, you may find yourself in need of one of these forecasts to avoid bad conditions that could cost you time and money, or get you lost. The modest annual budget for the SEC expended to create these forecasts seems an astonishingly small investment given that over $110 billion in satellite real estate, and hundreds of billions of dollars of annual electrical utility revenue can be impacted by a space weather event.
Because of a lack of data, and a regular stream of it that scientists can count upon over time, our understanding of space weather is still primitive. We cannot anticipate so much as a day in advance, which solar region will spawn a solar flare or a Coronal Mass Ejection. We cannot anticipate the properties of a Coronal Mass Ejection with any reliability until it reaches one of NASA’s sentry satellites (ACE, WIND, SOHO) in L1 orbit, two million miles from the Earth. This gives us barely 30 minutes to recognize a problem is on the way. Satellites such as POLAR, IMP-8 and Geotail patrol geospace, but cannot be everywhere at once to give us literally a ten-second warning. With resolutions measured in thousands of miles, we cannot anticipate how the geospace environment will respond to a storm at a level of detail that is useful for a specific military or commercial satellite. Instead, many spacecraft designers have to rely on statistical models of the geospace environment that are 30 years old. This is like trying to predict tomorrow’s rainfall in New York City using data from the same day of the year recorded between 1960 and 1970.
It isn’t just the satellite industry and NASA’s manned space program that will benefit from the next generation of forecasting tools provided by Living with a Star and the National Space Weather Program. The third leg of this particular stool is the electrical power industry. Progress in this area has been difficult because of the wide-spread opinion that an electrical power emergency caused by adverse space weather is so infrequent that it is ignorable. In fact, this is not the case at all as we discovered in Chapter 4. Every time there is a geomagnetic storm with a severity of Kp = 6, electrical utility companies in the northern-tier states experience strong GIC currents that trip some of their protection systems and require manual intervention to reset them. When Kp reaches 7 or 8, dozens of these temporary interruptions sweep across the electrical grid of North America, Scandinavia and Great Britain. When Kp reaches 9, as it does at least once every solar cycle, hundreds of equipment failures sweep across North America and Europe in a matter of a few minutes. Depending on the time of year and the amount of operating margin available, blackouts become an expensive and public reality.
The US electrical power industry, with annual revenues of $250 billion, has only recently warmed-up to GICs as a significant problem requiring serious attention. Countries such as England, Scotland and Finland have been aggressively working on GIC mitigation since 1982. In England, for example, they have a single power utility that includes Scotland and Wales, and also connects with France across the English Channel. During the 1980’s, they endured a number of strikes by coal miners which triggered electrical supply problems and sensitized the public to just how vulnerable their lifestyles are to even intermittent losses of power. When British and US electrical engineers brought GICs to the table, utility managers were much more interested in mitigating even these rare impacts. The British power industry welcomed any new insight that might keep their customers happy.
In 1991, Bill Feero an electrical engineer from the Research and Management Corporation in State College, Pennsylvania developed a real-time monitoring system called Sunburst, which could measure the GIC currents at hundreds of locations across North America and Europe. All that participating electrical utility companies, such as the Potomac Electric and Power Company (PEPCO), Virginia Electric Power Company (VEPCO), and Baltimore Gas and Electric (BGandE), needed to do was to install a passive measuring device on selected transformers at their sub-stations. These devices, no bigger than a bagel, transmit by phone line, minute-by-minute GIC current measurements to Sunburst headquarters in Pittsburgh. In essence, the system turns the power grid into a vast space weather gauge. When the readings exceed preset levels, warnings can be sent to the participating power companies to alert them to conditions that could lead to an equipment outage.
PEPCO, VEPCO and BGandE, despite their locations in regions that are usually not greatly at risk from geomagnetic storms, are no strangers to outages. A January 1999 ice storm turned out the light and heat for over 400,000 people in Maryland,Virginia and Washington D.C. for up to five days. Although it was not widely reported, is was a major hardship for many residents of the Washington D.C. area. The electrical utilities were under constant, unrelenting attack from private citizens and the media to reconnect their services. One street waited hopelessly by for two days, while the lights on the streets surrounding were quickly brought back on. The bad press, and harsh feelings directed towards the electrical companies undid years of hard work by the utilities to portray themselves as ‘friends’. It was not surprising that these same utilities appeared at a conference in Washington D.C where Bill Feero rolled-out his Sunburst system and asked them for support. Even rare geomagnetic events could throw their customers into a frenzy, and the few thousand dollars for the Sunburst system seemed like a bargain.
Besides its potential for helping some power companies avert the embarrassment of another blackout, GIC monitoring equipment has also made several important discoveries of its own. Prior to the advent of the Sunburst system, many engineers thought that GICs could cause power transformer failure only under extreme conditions, and in general, it would involve only the primary ’60-cycle’ electrical responses of the equipment. Thanks to active monitoring of GIC currents, engineers now recognize that the higher harmonics of this 60-cycle frequency can also do significant damage by causing stray currents to flow in large turbine generators. Also, capacitor banks, which help maintain network voltages, can be tripped and taken off-line by the higher-frequency voltage spikes produced by these harmonic GIC currents.
One problem with real-time power system monitoring is that, although it is far better than being caught unawares, once a GIC starts to happen, you have precious few seconds to do anything meaningful. Severe storms like the one that caused the Quebec blackout are preceded by very normal conditions, and within a few seconds the GIC currents rise sharply to their full levels of hundreds of amperes. Local, real-time measurements alone, no matter how widespread and accurate, will probably not be enough by themselves to guide plant managers to take meaningful action. The information can, however, be used in a post-mortem or forensic mode to let plant managers know which devices are the most vulnerable to GIC assault. Another approach is to try to forecast when GICs will happen. This is not as impossible as it seems.
John Kappenman at MetaTech Corporation, has developed a sophisticated forecasting tool that lets electrical utilities anticipate just what the next space weather event will do to transformers and other power systems. Real-time data from the ACE satellite is used to gauge the magnetic properties of the incoming solar wind 30-45 minutes before it arrives at the Earth. The forecasting program, which runs on a Pentium-class PC, calculates the strength of the auroral currents over the Northern Hemisphere, and what the ground-level voltages will be induced from this current. This part of the calculation requires that an accurate geological model of the Earth’s crust under the transformer be specified to a depth of nearly 700 miles. Once this ‘geopotential’ map is created, a detailed model of the transformers, and their interconnections is used in the final step of calculating the GIC that is induced in the transformer’s ground system. Although the system is not perfect, it can predict very accurately the strength of the GIC at any moment in time, so long as there is ACE solar wind data available.
An electrical utility company running Kappenman’s ‘PowerCast’ system can look at any line, transformer or other component in their system and immediately read out just what it will do when the solar wind hits the Earth traveling at a million miles per hour. With 30 minutes to spare, it is now possible to put into action a variety of counter-measures to gird the grid from failure. PowerCast is currently in operation in Great Britain where it has been used for several years to improve the reliability of their national power grid. Entry into the North American utility system has been sluggish because, at a cost of a few thousand dollars per month, many utility managers still do not see it as a high priority investment given that space weather disruptions are so infrequent.
The lynchpin in this powerful system of GIC forecasting is scientific research satellites such as NASA’s ACE satellite and its on-board solar wind monitor. At a distance of two million miles towards the Sun, its instruments report on the second-by-second changes in the density, speed and magnetic orientation of the solar wind. For decades space scientists have known that when the magnetic polarity of the wind dips southwards, it triggers violent instabilities in the Earth’s magnetic field in the Northern Hemisphere. When like-polarity conditions prevail, the magnetosphere receives a constant but firm pressure from the wind in much the way that two magnets with the same poles facing each other push apart. But when the polarities are opposed, fields intermingle and reconnect into new shapes in a dynamic process. Currents flow in the Polar Regions of the Earth, and it is these currents that cause VAR-generating GICs to bloom like dandelions on the ground.
Ironically, the ACE satellite seems constantly on the verge of cancellation by NASA to make way for newer missions. The fact that ACE data plays such a vital role in GIC forecasting for the power industry seems to be of no special interest to NASA. NASA is, after all, a research organization supported by the US taxpayer, not a for-profit corporation looking for commercialization opportunities. The viability of the ACE mission at NASA hinges totally on its scientific returns and not its potential for practical applications. NASA also has to make way for future missions with the declining, and politically vulnerable, space research budgets that US Congress, in its wisdom, has mandated. Meanwhile, in England, which uses the PowerCast technology, ACE is seen as a powerful ally in keeping their entire multi-billion dollar power system operating reliably. Rutherford Appleton Labs has invested in its own independent ACE satellite tracking station to intercept the solar wind data. Arslain Erinmez, Chief Engineer at the National Grid Company in England, notes that “The British power industry would be happy to do anything it can to keep ACE going”. While the destiny of satellites such as ACE turns completely on how well its scientists can convince NASA and Congress not to terminate it, its politically-silent, commercial clients both domestic and foreign continue to mine its data to help the power industry keep your electricity flowing.
NASA, and the space scientists that advise this agency, are not interested in building a follow-on satellite to ACE just to supply private industry with a forecasting tool, unless it can be justified on solely scientific terms of advancing our understanding. Even so, any prospective follow-on to ACE will have to compete with astronomy satellites such as the Next Generation Space Telescope to secure its funding, and with MAP, AXAF and Hubble Space Telescope to maintain their year-to-year operating budget. NASA has been forced into a zero-sum, or even declining, fiscal game by Congress, at a time when space research has exploded into new areas and possibilities. Whether the power industry gets a GIC-forecasting tool to keep Boston lights turned on, or NOAA’s Space Environment Center can help satellite owners prevent another major communication satellite outage, hinges on whether investigating quasars is deemed more important than studying the physics of solar magnetic field reconnection.

Submit your review | |