Chapter 2: Hello: Is anyone there?
Marconi fully expected that radio broadcasting would be resiliant to solar disturbances compared to telegraphy and telephony, because it used a very different medium to transmit its signals. While disturbances from the September 1909 Great Aurora were recorded world-wide in a variety of telegraph and telephone systems, he considered this storm and its impacts a lesson to be learned, not by wireless telegraphy, but by the competing communications technologies. Like the folkloric Norwegian boy who impudently whistled at an aurora and was killed, Marconi’s expectation that wireless would not be affected by solar storms was soon revealed to be mere bluster. In 1926, another Great Aurora lit up the skies, bringing this 25-year sense of security to an abrupt end. International wireless tests with US short-wave radio operators attempted to pick up stations in Wales, Argentina, and Peru. Electrical disturbances interfered with both broadcasting and telegraph services. Scientists blamed all of this on an unusually large sunspot visible on the Sun. Exactly one solar rotation later on February 23, the same sunspot group was positioned as it had been for the January storm, and again problems erupted on the telegraph wires and in the ether. This time, short-wave radio reception of stations to the north of Ames, Iowa were blocked. Stations to the south came through clear as a bell. The third and final storm of this series arrived a week later from a different group of sunspots near the center of the sun’s disk. Again, voltage surges in the telephone lines were recorded, and short-wave reception only improved after the surges ended.
Just as telegraphy needed the Earth itself to make it work, wireless radio also needed to have the cooperation of the Earth to make it work. To get radio waves to skip from a transmitter to a distant receiver across the Atlantic, something in the atmosphere had to be there to serve as a convenient reflecting layer. British physicists A.E. Kennelly and O. Heavyside found out what it was in 1902. It was nothing less than a new atmospheric layer of charged particles mixed up within a dilute sea of air. For decades, the ‘ionosphere’ as we now call it, went by the name of the Kennelly-Heavyside Layer. The Heavyside Layer was even immortalized by T.S. Elliot in his poem ‘Cats’ as the place where cats go when they die. The actual ionosphere is far less exciting.
Chapter 3: Between a rock and a hard place.
In July 1998, electrical power transmission congestion in Wisconsin and Illinois blocked the transport of power from northern supplies to consumers in southern states who were sweltering in the heat. Power lines can only transport a fixed amount of power, and the essential transmission lines along the electrical superhighway were experiencing the equivalent of gridlock. Not enough volunteers could be found in the south to stop using their air conditioners, so the local electrical utilities had to go to local energy suppliers to purchase temporary ‘make up’ energy. Within a few hours, the price per megawatt soared from $20 to $7000 and wiped out the yearly profits from several southern utilities. A similar problem happened in 1999 during hot weather in the Midwest and northeast. De-regulation has forced utilities into a wait-and-see mode where investments in infrastructure are postponed, and new capacity is not planned. All of these factors work together to make even minor geomagnetic storms a potential ‘straw’ which can break the back of regional electric power pools.
Should more lines be installed so that gridlock conditions can be reduced? Not necessarily. The installation of more transmission lines to carry higher voltages over longer distances also increases GIC susceptibility with every mile installed. The currently induced voltages are in the range of 1-6 volts per kilometer and cause GICs that are nearly three times higher than what was common 20 years ago. The most direct solution is to increase electrical margins between supply and demand and ride out the storm. With de-regulation, it is unlikely that private companies will invest in new, expensive, power plants especially over the objections of environmentalists. So it seems that although satellite vulnerability will eventually solve itself through commercial pressures, the electrical power industry seems stalemated in their choices to mitigate GIC problems in the future.
Chapter 9: Business as Usual,
Despite a miserable 1998 which cost them over $600 million in in-orbit satellite payouts, insurance companies still regard the risks of in-orbit failures as a manageable problem. The loss of Intelsat 708 during a launch in the Peoples Republic of China triggered a Congressional investigation on the role of commercial space insurance in technology transfer to the PRC. The August 1999 Cox Report was the outcome of this investigation, and it publically revealed many of the details of how satellite insurance operates. Launch services and space insurance markets generated $8 billion in 1997 and $10 billion in 1998. Since private insurers entered the space business in the 1960’s, they have collected $4.2 billion in premiums and paid out $3.4 billion in claims. Insurers consider today’s conditions a buyers market with $1.2 billion capacity for each $200 million satellite. There is a lot of capacity available to cover risk needs.
Like any insurance policy the average home owner tries to get, you have to deal with a broker and negotiate a package of coverages. In low risk areas, you pay a low annual premium, but you can pay higher premiums if you are a poor driver, live on an earthquake fault, or own beach property subject to hurricane flooding. In the satellite business, just about every aspect of manufacturing, launching and operating a satellite can be insured, at rates that depend on the level of riskiness.
A satellite owner applies for several types of coverage for a single satellite. The first phase usually ends with the intentional (as opposed to accidental) ignition of the rocket engines. This is followed by a phase that ends when the satellite is inserted into orbit; and a third phase that begins after a predetermined shake-out period, and lasts for the duration of the satellites lifetime. This on-orbit, operational phase is considered a very stable source of revenue when an insurance underwriter carries several satellites in its insurance portfolio. Space insurance is syndicated, which means that each underwriter assumes only a percentage of the risk for each satellite. Typically for a given satellite, 10-15 large insurers (called underwriters) and 20-30 smaller ones may participate. There are about 13 international insurance underwriters that provide about 75% or so of the total annual capacity.
To get insurance, a satellite owner selects an insurance broker who acts as an intermediary between the insurance underwriters and the satellite owner. The broker writes the policy, manages transactions and settles claims. Brokers do not lose money in the event of an accident, but are paid a commission on the basis of the size of the insurance package they write. The satellite owner prepares a technical document describing the satellite and launch vehicle in detail, and any risks associated with the technology. This is presented to the broker, who then presents this to the various underwriters during the negotiation phase. This information is confidential and cannot be divulged to the public. Brokers and underwriters often retain their own staffs of independent technical experts, space scientists, and engineers to advise on the risk factors and to decide upon appropriate premium rates. The policy is then negotiated, with the broker serving as the intermediary between owner and underwriter. This can take up to three years prior to launch for major satellite systems. A 10-20% deposit is paid to the underwriters no later than 30 days before launch. Typically, the premiums are from 8-15% for the launch itself. In-orbit policies tend to be about 1.2 to 1.5% per year for a planned 10-15 year life span once a satellite survives its shake-out period.
According to ….. at International Satellite Brokers in Virginia, this period was once as short as one year, but has now grown to as long as five years depending on the perceived riskiness of the satellite. If a satellite experiences environmental or technological problems in orbit during the initial shakeout period, the insurance premium paid by the satellite owner can jump to 3.5 – 3.7% for the duration of the satellite’s lifetime. This is the only avenue that insurers have currently agreed upon to protect themselves against the possibility of a complete satellite failure. Once an insurance policy is negotiated, the only way that an insurer can avoid paying out on the full cost of the satellite is in the event of war, a nuclear detonation, confiscation, electromagnetic interference or willful acts by the satellite owner that jeopardize the satellite. There is no provision for ‘Acts of God’ such as solar storms or other environmental problems. Insurers assume that if a satellite is sensitive to space weather effects, this will show up in the reliability of the satellite, which would then cause the insurer to invoke the higher premium rates during the remaining life of the satellite. Insurers, currently, do not pay any attention to the solar cycle, but only assess risk based on the past history of the satellite’s technology.
As you can well imagine, the relationship between underwriters and the satellite industry is both complicated and at times volatile. Most of the time it can be characterized as cooperative because of the mutual interdependencies between underwriters and satellite owners. During bad years, like 1998, underwriters can lose their hats and make hardly any profit from this calculated risk-taking. Over the long term, however, satellite insurance can be a stable source of revenue and profit, especially when the portion of their risk due to launch mishaps is factored out of the equation. As the Cox Report notes about all of this,
“The satellite owner has every incentive to place the satellite in orbit and make it operational because obtaining an insurance settlement in the event of a loss does not help the owner continue to operate its telecommunications business in the future. To increase the client’s motivation to complete the project successfully, underwriters will also ask the client to retail a percentage [typically 20%] of the risk” [Cox Report, 1999]
According to Philippe_Alain Duflot, Director of the Commercial Division of AGF France,
“…the main space insurance players have built up long-term relations of trust with the main space industry players, which is to say the launch service providers, satellite manufacturers and operators. And these sustained relations are not going to be called into question on the account of a accident or series of unfortunate incidents”.
Still, there are disputes that emerge which are now leading to significant changes in this relationship. Satellite owners, for instance, sometimes claim a complete loss on a satellite after it reaches orbit, even if a sizable fraction of its operating capacity remains intact after a ‘glitch’. According to Peter D. Nesgos of the New York law firm Winthrop, Stimson, Putnam and Roberts as quoted by Space News,
“In more than a dozen recent cases, anomalies have occurred on satellites whose operators say they can no longer fulfill their business plans, even though part of the satellite’s capacity can still be used”
This has caused insurance brokers to rethink how they write their policies, and for insurance underwriters to insist on provisions for partial salvage of the satellite. In 1995, the Koreasat-1 telecommunications satellite owned by Korea Telecom of South Korea triggered just such a dispute. In a more recent dispute underwriters actually sued a satellite manufacturer Spar Aerospace of Mississauga, Canada over the AMSC-1 satellite, demanding a full reimbursment of $135 million. They allege that the manufacturer ‘covered up test data that showed a Spar-built component was defective’. Some insurers are beginning to balk at vague language which seemingly gives satellite owners a blank check to force underwriters to insure just about anything the owners wish to insist on.
One obvious reason why satellite owners are openly adverse to admitting that space weather is a factor, is that it can jeopardize reliability estimates for their technology, and thus impact the negotiation between owner and underwriter. If the underwriter deems your satellite poorly designed to mitigate against radiation damage or other impulsive space weather events, they may elect to levy a higher premium rate during the in-orbit phase of the policy. They may also offer you a ‘launch plus five year’ rather than a ‘launch plus one year’ shakeout period. This issue is becoming a volatile one. A growing number of stories in the trade journals since 1997 report that insurance companies are growing increasingly vexed by what they see as a decline in manufacturing techniques and quality control. In a rush to make satellites lighter and more sophisticated, owners such as Iridium LLC are willing to loose six satellites per year. What usually isn’t mentioned is that they also request payment from their satellite insurance policy on these losses, and the underwriters than have to pay out tens of millions of dollars per satellite. In essence, the underwriter is forced to pay the owner for using risky satellite designs, even though this works against the whole idea of an underwriter charging higher rates for known risk factors. Of course, when the terms of the policy are negotiated, underwriters are fully aware of this planned risk and failure rate, but are willing to accept this risk in order to profit from the other less risky elements of the agreement. It is hard to turn-down a five year policy on a $4 billion network that will only cost them a few hundred million in eventual payouts. The fact is that insurers will insure just about anything that commercial satellite owners can put in orbit, so long as the owners are willing to pay the higher premiums. Space weather enters the equation because, at least publicaly, it is a wild card that underwriters have not fully taken into consideration. They seemingly charge the same in-orbit rates ( 1.2 to 3.7%) regardless of which portion of the solar cycle we are in.
Chapter 10: Living with a Star.
Modern science’s renowned ability to predict the future of many different physical systems is a dazzling accomplishment, and the culmination of thousands of years of careful study of the physical world. So, why can’t we just ‘plug in the numbers’ and predict when the next solar storm will tackle one of our satellites, turn the lights out in Bangor, or irradiate one of our astronauts? Because the sun and the earth are a complex system, and we lack enough data to see the big picture clearly; but it’s not for a lack of trying.
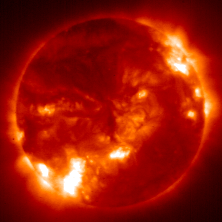
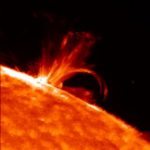
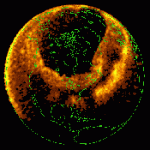
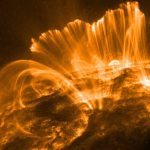
Solar flares are among the most awesome outbursts of energy in the solar system: a billion hydrogen bombs of energy blast matter into space. Invisible beams of high-energy protons leap out into the void. If the Earth is in the way, the proton beams penetrate into the ionosphere like a knife through soft butter, and cause chemical and electrical changes across the entire daytime hemisphere of the Earth. Like lightning discharges from a thunderstorm, they can also be spectacular and beautiful in their own deadly ways.
The Great Aurora of September 9, 1859 lit-up the skies around the world, and caught astronomer Richard Carrington’s eye just as he was about to end his observing session at the telescope. Carrington was an avid watcher of sunspots, and he had been watching a spectacular sunspot round the western limb of the sun during the last few days. Within minutes, a powerful optical flare burst into light and then vanished. Meanwhile, miles away at the Kew Observatory outside London, the local magnetic field went haywire. This flare did much more than merely tilt compass needles and make a few astronomers sit upright. In France, telegraphic connections were disrupted as sparks literally flew from the long transmission lines. Huge auroras also blazed in the sky as far south as Hawaii, Cuba and Chile. People spoke about this, now long-forgotten, event much as we have obsessed about ‘Killer Asteroids’ in recent years.
Despite the coincidence of flare and aurora, Carrington’s observation was actually a fluke. Astronomers know that such brightenings visible to the eye through a telescope are literally a once-in-a-lifetime event, and require especially titanic releases of energy on the sun. For the next 50 years after Carrington’s sighting, many careful studies were made of the solar surface and magnetic storm records, but no other sudden brightenings of the solar surface were ever seen again. It wasn’t until the invention of the spectroheliograph, and its successor the visible light spectrohelioscope, between 1892 and 1910 that many more sudden brightenings were captured, and their geomagnetic impacts could be properly assessed. Ultimately, the only proven way to anticipate solar flares, and the geomagnetic and ionospheric effects that might follow, is to watch the solar surface itself. Constantly.
Since the 1960’s, solar physicists have known that sunspots with opposite polarity cores, called ‘unbrae’, within the same envelope, called ‘penumbrae’, were a potent spawning ground for flare activity. If a flare had been spotted near an active region, the odds were excellent that there would be more flares to follow from this same region over the course of the next few weeks. It didn’t matter how big the sunspot group might be. What counted was how tangled-up the magnetic field was in a small region of the solar surface. In the 1970’s, new magnetic imaging technologies allowed flaring regions to be correlated with areas where strong shearing was occurring: magnetic fields with opposite polarities were trapped in regions where gas motions were dynamically moving the magnetic fields around in very small parcels of gas. This seemed to be the crucial observational clue to anticipating when a flare is likely to breakout.
The BearAlert program eventually established an ‘eight-fold way’ for evaluating whether conditions were ripe for a flare event or not. Current, official, techniques used by NOAA’s Space Environment Center use images of the entire sun, rather than detailed studies of individual active regions, and tend to be accurate only about 25% of the time. The BearAlerts, with their much more detailed assessments of individual sunspot groups, scored correct predictions for M and X-class flares about 72% of the time. What is also encouraging is that the method developed by Zirin and Marquette rarely misses the really big M-class flares that can do astronauts and satellites serious harm. The amount of lead-time we have for solar flares has now expanded from literally a few minutes, to several days.
There is some indication, however, that a perfect record of correct calls may be forever out of reach. Solar activity, at the scales that trigger flare events, is largely a random process, just as the pattern of lightning strikes during a thunderstorm.
Ludwig Bierman at the University of Gottingen was a comet specialist, and for some time had puzzled over comet tails, and why it was that they pointed in the directions that they did. The tails should always point directly away from the sun if the only thing acting on them was the pressure from sunlight. But by 1951, the data he had accumulated over the years had turned up another oddity. There was a significant difference between where the tails were actually pointing, and where the light pressure should have pushed them. This could only mean that some other force was acting on them. Comet tails, like million-mile-long windsocks, pointed in the direction that the solar wind was blowing near them.
During the first few years of the Space Age, the solar wind came into even clearer view, thanks to the Mariner 2 spacecraft launched in 1962. Despite what it could do to comet tails, there isn’t really much to this wind at all.
The number of geomagnetically disturbed days rises and falls with the sunspot cycle. The largest number seems to peak a year or so before, and a year or so after, sunspot maximum. The reason for this is not known. Also, these disturbances seem to be more intense in the March-April, and September-October periods. Here we think we understand this pattern a little better. The Earth’s orbit is tilted five degrees to the equator of the sun. This means that there will be two ‘seasons’ during the Earth year around the Equinoxes, when it is located at solar latitudes where sunspots and other active regions are most common. Like a soldier peering over the edge of a foxhole, at these latitudes, more of the solar storminess catches up with you. The solar equatorial zone, itself, is rather quiet during much of the solar cycle. If you want the best chance of seeing a dramatic aurora, wait until sunspot maximum conditions prevail, and visit northern latitudes during the March and September Equinoxes.
As interesting as Kp is, it does little to give you a meaningful advanced warning of what will soon be happening where you are located. Once you see the Kp index growing in size to become a Major Storm, the damage to your technology has already been done. Historical information about past storms tells the unhappy tale that, by the time you see Kp grow to the level of a medium-sized storm with Kp = 6, you have a roughly one in five chance it will continue to grow into a large storm with Kp =7.0. You also have a roughly one in 15 chance it will become a major storm with Kp=9. It only takes a few hours for these kinds of changes to play themselves out. More troubling than this, geomagnetic conditions can look fairly normal for hours, then within minutes, suddenly deteriorate into a severe storm. Despite its limitations for advanced warning, Kp is in many ways the only indicator that is readily available each day, so a variety of groups and industries find even this kind of information better than none at all: the electrical power industry for insta
Although plasmas, fields and currents form systems of staggering complexity, there are still consistent patterns of cause and effect that can be traced with considerable mathematical precision. There is nothing ad hoc about how a current of particles will generate a specific amount of magnetic field strength. It doesn’t matter if the current is one ampere of electrons in a wire, or a dilute 500,000 ampere river of plasma orbiting the earth. Maxwell’s famous equations, combined with suitable ‘equations of motion’, are in principle all that you need to describe the essential features of any ‘magneto-hydrodynamic’ system such as the earth and sun. But, even with the theoretical game plan clearly defined, there is still a lot that is left unspecified. Theorists have a bewildering number of mathematical choices to make in deciding which ingredients to keep and which to throw out. The more sources and interactions you add to your equations, the messier they become, and the harder it is to wrest a concrete mathematical prediction from them. High-quality data is the only looking glass that lets space scientists hit upon the right clues to guide them. Like learning how to dance, it is important to start with the correct foot forward, and only a careful study of Nature gives us the right choreography. Eventually, space scientists managed to win their way to a rather firm set of procedures for tackling questions about the sun-earth system. These ‘arrivals’ were not in the form of some monolithic, single, comprehensive theory of how the whole shebang worked, but a series of minor victories which formed their own separate tiles in a larger puzzle.
Astronomers, armed with telescope and spectroscope, investigated the solar surface, and pieced together the physical structure of the photosphere-chromosphere-corona region. They dissected the chemical compositions of the solar gases, measured their temperature, density, and speed and crafted a working model of the solar atmosphere. They used powerful new ‘Zeeman-splitting’ techniques to measure surface magnetic fields. With Maxwell’s equations, the magnetic data helped theorists build models of the geometry of this field around sunspots and extend them deep into the corona. By 1960, a preliminary theory of why there is a sunspot cycle, and why sunspots occur, was hammered-out by Eugene Parker at the University of Chicago and Horace Babcock at the Hale Observatories. Parker also went on to craft a ground-breaking theory, and mathematical description, of the solar wind as it leaves the coronal regions and flows throughout the solar system. Solar physics was, essentially, described by the complex mathematics of magneto-hydrodynamics. The particular phenomena we observed was ‘only’ the working-out by the sun of specific mathematical solutions, driven by its complex convecting surface. What remained to be understood were the details of just how the solar magnetic field was generated, how the corona was heated, and why solar flares and other impulsive events get spawned. The missing link seemed to be the various gyrations of the magnetic field itself, but only new instruments in space would let scientists chase the magnetic forces down the rabbit’s hole of decreasing size.
By the way, you should always keep in mind that things could be far worse for us than they are! For decades, astronomers have been studying stars that are close cousins to our sun; a middle aged, G2-class star. At Mount Wilson Observatory, careful measurements of some of these stars show a distinct rise and fall in certain spectral lines which on our own sun are indicators of solar activity. These stars also show periodic ‘sunspot cycles’ with periods from a few years, up to 30 years per cycle. Others show a constant level of activity, as our own sun would have during the Maunder Minimum between 1610 and 1700. So, solar activity is not unusual among the kinds of stars similar to our sun. What is rather alarming is that some of kindred stars belt-out super flares from time to time. In fact, according to Yale astronomer Bradley Schaefer, sun-like stars normally produce one of these superflares every century, “One of these cases I have is a star, S-Fornax, where for a 40-minute period it was seen to be three magnitudes brighter than usual”. The power from the flare made the star appear nearly 20-times brighter than usual. One of these superflares would be about 10,000 times more powerful than the solar storm that caused the 1989 Quebec blackout! According to Schaefer, portions of the surfaces of the outer ice moons of the solar system might be melted, much of the ozone layer would be destroyed, and the entire satellite fleet would be permanently disabled. It is believed that the reason the sun doesn’t have these flares is that it doesn’t have a close companion star or planet that is magnetically active, and able to tangle-up our sun’s magnetic field.
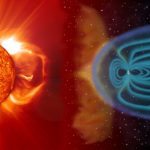
Meanwhile, back at the earth, the challenges were nearly as daunting. The shape of the earth’s magnetic field was eventually defined by numerous ground-level measurements, and with Maxwell’s equations, extended thousands of miles into space. Although the general shape was still much like that of a simple bar magnet, there were noticeable lumps to it that followed geological changes in surface rock conductivity, and sub-surface irregularities reaching all the way to the core of the earth itself. By the 1930’s, physicists Sydney Chapman and Vincenzo Ferraro had mathematically described the impact that an ‘intermittent’ solar wind would have upon the earth’s magnetic field. It was a staggering tour de force, linking together many separate geophysical systems and phenomena. The compression of the sunward side of the field would eventually lead to the amplification of a powerful ring of current flowing in the equatorial zone. Aurora had been studied meticulously since the 19th century, and eventually gave up their quantum ghosts once the spectroscope was invented. Something was kicking the atmospheric atoms of oxygen and nitrogen so that they glowed in a handful of specific wavelengths of light. Through the rather contentious technical debates beginning with Kristian Birkelund in 1896, and ending with Hannes Alfven in the 1950’s, the general details of how aurora are produced came into clearer view. Some process in the distant geotail region was accelerating currents of electrons and protons along polar magnetic field lines. Within minutes, the currents dashed against the atmosphere and gave up their billions of watts of energy. There was, however, no detailed mathematical model that could recover all of the specific shapes and forms so characteristic of these displays. What was certain, however, was that we were living inside the equivalent of a TV picture tube, and the electron beams from the distant geotail region were drawing magical shapes on the phosphor screen of the sky.
The dawn of the Space Age had brought with it an appreciation of most of the main ingredients to the complete geospace environment. All that seemed to be lacking in moving the frontier forward was more data to describe the geospace system in ever more detail. New rounds of complex equations needed to be fed still more detailed data to keep them in harmony with the real world. Space physics had reached a watershed moment where mathematically precise theories were sorely in need of specific types of data to help them further evolve. One small step along this way was to create a series of ‘average’ models of the particles and fields in geospace.
NASA became a leader in developing and refining models of the earth’s environment through the Trapped Radiation Environment Modeling Program (TREMP) in preparation for the Apollo moon landings. The models combined the measurements made by dozens of satellites such as Telstar and Explorer, and even instruments carried aboard the Gemini spacecraft. They didn’t attempt to explain why the conditions were what they were, or how that got that way. Unlike the specific theories of the sun-earth system and its various components, TREMP program models, such as AE-8 and AP-8, were merely statistical averages of measured conditions in space and in different localities during solar maximum and solar minimum conditions only. They could not predict conditions that had not already been detected or could be extrapolated from the smoothed averages. The models did not include solar flares or other short-term and unpredictable events that can substantially increase accumulated radiation dosages. This was the best that could be done by the 1970’s, and it is amazing that these models are still in wide use over 30 years later. Although they are adequate for designing satellite radiation shielding, they are useless for forecasting when the next storm will arrive. Some researchers don’t even think they are all that useful for high-accuracy satellite shielding design.
Some sample headlines from weekly journals such as ‘Space News’ (See bibliography)
“Insurers Beleaguered by Rash of Failures in ’98”
“Space-weather El Nino has astronomers worried”
‘Digital Flub: Bank Computers Take a Hit’
“NASA Hunts for Satellites to Carry Science Payloads”
“$1.5 billion trans-Atlantic fiber optic cable project planned”
“Global Crossing to Expand Transatlantic Capacity Ahead of Schedule”
“Satellite Makers Use Cheaper, Faster Approach: Off-the-shelf Parts allow smaller firms to compete”
“Insurers Warn Against False Expectations”
“Solar Storm Eyed as [Telstar 401] Satellite Killer”
“Space Weather Monitoring Faces Funding Woes”
“NASA Urged to Pursue Study of Radiation Effects”
“SOHO Data May Enhance Solar Storm Prediction”
“Insurers Battle With Satellite Makers Over Quality Control”
“Operators Place High Value on Space Weather Forecasting”
“[It’s] Official: Geostationary Satellites Will Disappear”
“Study Explores Space Weather Risk to Natural Gas Pipeline in Finland”
“Satellite Failures Spur Power-Amplifier Developments”
“Solution to satellite defect still eludes Matra”
“Wary Investors Avoiding Satellite Deals”
“Iridium Satellites Please Motorola, Despite Losses”
“Vague Satellite Policies Increase Insurance Claims”
“Insurers Plan to Raise Premiums: Underwriters feel pressure of mounting satellite claims”
“Japan Developing Satellite to Warn of Solar Flares”
“More In-Orbit Spares Planned: Recent failures spur steps to guarantee service”
“Globalstar, Iridium Enjoy Soaring Market Value”
“ICO Plans to Cut Costs, Delay Service”
“Immarsat Approves Internet Satellites”
“Motorola Gives Iridium Deadline”
“Iridium Officials Insist Venture Will Survive”

Submit your review | |