I am a lineman for the county
And I drive the main road
Searching the Sun for another overload
(Wichita Lineman, song)
It was turning out to be another sweltering day along the Pacific Coast from Oregon to Baja California. Normally, the more moderate temperatures in the northwest allowed extra power to be available to feed millions of air conditioners in the south, but not today. Temperatures climbed into the triple digits as the Sun rose higher in the sky. Already hot power lines from the Oregon power grid began to overheat as they carried much of the 21,450 megawatts needed to support thousands of air conditioners coming on-line every minute. On August 10, 1996, a 500,000-volt power line between Keeler and Allison sagged into one of many hazelnut trees. Automatic sensors in the huge Pacific Intertie sensed a problem and began shutting the system down, and in an instant, six million people found themselves without power for several days.
In the San Francisco Bay Area, the outage started at 4:00 PM and lasted over six hours. It was the second summer blackout for California residents in less than two months since an earlier July incident which affected 14 states. This time, only six states were involved including Texas and Idaho. BART subway lines were without power and most of the cable cars in San Francisco could not be budged. 6000 passengers were stuck in planes that were taxing off the runways at San Francisco International Airport, and airports in Oakland and San Jose. Huge clouds of black smoke belched from the Chevron refinery in Richmond as equipment malfunctioned. Shoppers at supermarkets in San Francisco actually enjoyed walking down darkened isles and thought the experience “surreal and dreamlike”. In the southern end of the state, a ten-mile stretch of beach was flooded by raw sewage as the Hyperion Treatment Plant poured six million gallons of untreated effluent into the ocean. The Republican National Convention was nearly routed when the lights blinked but stayed on. Delegates, however, returned to darkened hotels and had to navigate massive traffic congestion to get there after a long day. Merchants throughout the six-state region that was affected, were forced to calculate merchandise taxes by hand for the first time in a decade. Disneyland had to evacuate Space Mountain, and Peets Coffeehouse in San Francisco gave away gallons of expensive coffee, rather than see it wasted. Los Vegas casinos found themselves plunged into darkness, without air conditioning or working slot machines.
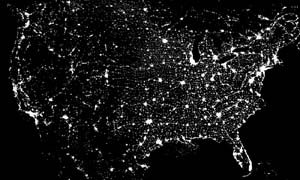
It was just one of those things that we have to get used to, given that we have over 180,000 miles of high voltage power lines criss-crossing the country. You would be surprised how often blackouts of one kind or another manage to rumble through our country, but major ones involving millions of people have been mercifully rare. Even the ones you never hear about have major impacts on various segments of the U.S. economy. A variety of temporary outages during the May-June, 1998 Midwest heat wave, cost steel manufacturers tens of thousands of tons of steel production, and millions of dollars in lost profits. Companies can purchase emergency power, but local electrical utilities charge them rates that are 100’s of times the regular rates. Even minor fluctuations in electric voltage which happen on a daily basis in many regions, can stop newspaper presses cold, and cost a printing company tens of thousands of dollars a year in extra labor and lost paper.
In virtually all of these cases, the cause of the blackout is something rather easy to visualize. A particular component fails, or a power line is downed, and this can often lead to a cascade of breakdowns that sweep through the power grid in literally a few seconds. It’s much harder to imagine the same nightmare happening because of a distant solar storm knocking-out your electrical power. It is such a counter-intuitive idea that, even when you are in the middle of such an event, the Sun is the last thing you think about as the cause of the problem. It’s much easier to point a finger at some dramatic natural phenomenon like a lightning strike, a downed tree ripping down a power line, or even human error. But like so many other freak events we hear about these days, eventually even rare cards get dealt once in a while.
Spectacular auroral displays can be breath taking, but what we have discovered over the years is that too much of a good thing can spell serious trouble. The last, major power outage to rock the United States happened on November 9, 1965 and led to a presidential investigation of the electric power industry. But this ‘Great Blackout of 1965’ is only one of many similar outages that we have had to endure, and many of these have direct ties to solar storms.
The first public mention that electrical power systems could be disrupted by solar storms appeared in the New York Times, November 2, 1903 “Electric Phenomena in Parts of Europe”. The article described the, by now, usual details of how communication channels in France were badly affected by the magnetic storm, but the article then mentions how in Geneva Switzerland,
“…All the electrical streetcars were brought to a sudden standstill, and the unexpected cessation of the electrical current caused consternation at the generating works where all efforts to discover the cause were fruitless”.
Well, of course they were fruitless. By the time the investigation had begun, the celestial agent responsible for the mess had already left town. In a repeat story a decade later, we hear about another aurora seen in Scandinavia on January 26, 1926.
“A breakdown of electrical power and light caused considerable inconvenience in Liverpool yesterday Mr. Justice Swift was trying a burglary case when the lights failed, and the hearing proceeded without lights”
These days, the news media rarely mention Northern Light displays during the Space Age, except perhaps as ‘filler’ on the Weather Channel. The United States is geographically closer to the auroral zone than most areas in Europe including Scandinavia, so we have a ring-side seat to many of these displays whether urban dwellers can see them or not. This also makes us especially vulnerable to geomagnetic disturbances and their auroral co-conspirators, and we experience these far more often than our European counterparts. With a little detective work, you can uncover short mentions of solar storm-related electrical problems in New England, New York, Minnesota, Quebec and Ontario. During every 11-year sunspot cycle, we get a wake-up call that our electrical power system is not as secure as we would hope it is.
Electrical power companies have supplied a widening net of consumers since the first 225-home, lighting system was installed in 1882 by Thomas Edison. The stealthy effects of geomagnetic disturbances took a very long time to reach a threshold where their impact could actually be registered. A few extra amperes from celestial sources went entirely unnoticed for a great many years. The watershed event came with the March 24, 1940 solar storm, which caused a spectacular disruption of electrical service in New England, New York, Pennsylvania, Minnesota, Quebec and Ontario. By then, it was entirely too late to do much about the problem. Power grids had already become extensive and commonplace.
The Great Aurora of August 2, 1972, triggered surges of 60 volts on AT&T’s coaxial telephone cable between Chicago and Nebraska. Meanwhile, the Bureau of Reclamation power station in Watertown, South Dakota experienced 25,000-volt swings in its power lines. Similar disruptions were reported by Wisconsin Power and Light, Madison Gas and Electric, and Wisconsin Public Service Corporation. The calamity from this one storm didn’t end in Wisconsin. In Newfoundland, induced ground currents activated protective relays at the Bowater Power Company. A 230,000-volt transformer at the British Columbia Hydro and Power Authority actually exploded. The Manitoba Hydro Company recorded 120-megawatt power drops in a matter of a few minutes in the power it was supplying to Minnesota.
Despite the stealthy mayhem visited on us by its Great Aurora, 1972 was actually a very good year for electrical power in North America. We had far more available power than we used even during peak load conditions in the summer. Air conditioners were still pretty rare even in the urban world. With each passing year, however, we have found more uses for electricity than the pace with which we have created new supplies for it. The advent of the personal computer alone has added more than 3,000 megawatts per year to domestic power consumption since the 1980’s. Steadily, the buffer between load and demand has been whittled away. Solar and geomagnetic storms continue to happen, but now there is much less wiggle room for power utilities to find, and purchase, additional power to tide them over. We don’t build new power plants with the fervor we used to during the Go-Go ’60s. No one wants them in their community, and those ugly power towers 100 feet tall are anathema to our suburban esthetics. So now utilities have learned how to buy and sell dwindling reserves of available power across states and whole regions.
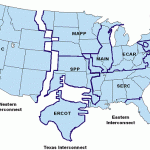
As North America has evolved into a unified power-sharing network of regions, each buying and selling a diminishing asset, US domestic power has become more vulnerable to solar storms buffeting the power grid in the more fragile northern-tier states and Canada. So long as one region continues to have a surplus at a time when another region needs a hundred megawatts, power is ‘wheeled’ through 1000-mile power lines to keep supply and demand balanced across the grid. In 1972, a typical utility might need to conduct only a few of these electromagnetic transactions each week. Now, it is common for thousands to be carried out, often by computer, in much the same way that stocks are traded on Wall Street. Solar storm disturbances that once hid under the cloak of an adequate power margin, are now exposed like the ribs of some malnourished relative. So now, only a strong ‘kick’ is needed to set a new series of dominoes in motion.
With communications technology, it is not too hard to figure out how aurora and magnetic storms do their damage. With power lines, however, there are several things going on at once. Unlike our understanding of how telegraph and telephone lines are affected, what we know about power lines and solar storm impacts is much more recent. Although there have been reports of power surges from auroral currents since the Great Aurora of 1940, routine measurements of induced power grid currents in places like the United States and Scandinavia were not started until at least the 1970’s. The results were quite surprising. What these measurements show is that geomagnetically induced currents (what engineers call GICs) on power lines can cause hundreds of extra amperes to flow in some lines, and induce voltages as high as 100 volts per mile of line (during the March, 1940 storm). Considering that we now have some 180,000 miles of high voltage power lines in North America, this is quite a large collector for even the smallest squall that wafts by on the solar wind.
All you have to do is take a Sunday drive in the country, and you will see tall towers marching like giants from horizon to horizon. Looped between them are cables as thick as your arm, carrying hundreds of thousands of volts of power. Individual lines can easily exceed 100 miles in length, so the induced voltages can be as high as several thousand extra volts. You would think that geomagnetic currents induced in power lines would not be much of a problem. It could even be considered as a new source of free electrical energy since carrying electricity is what power lines are designed to do. The problem is that the geomagnetic currents are the wrong types. They are similar to the kind of electricity you get in a battery called Direct Current (DC). The electricity you get from a plug on the wall is Alternating Current (AC). In a system designed to carry AC electricity, DC currents are very bad news.
The electrical power grid is composed of many elements, and you can think of it as a set of rivers flowing overhead. Large rivers carry the electricity from distant generation stations (Dams, Hydroelectric Facilities and Nuclear Plants) on supply lines of 138,000 volts or higher. These are carried as three cables (2 ‘hot’ and one defining the ‘ground’ in a 3-phase system) suspended atop 100-foot tall towers that you will see out in many rural areas. These supply cables terminate at regional sub-stations where the high voltages are converted into lower voltages from 69,000 volts to 13,800 volts. These lines then enter your neighborhoods atop your local telephone poles where a neighborhood transformer steps this voltage down to 220 and supplies a dozen or so individual houses. Like an orchestra, this entire network acts as a single electrical circuit that has complex ways of vibrating electrically, depending on the kinds of loads it is serving at a given moment. Typically, various components such as transformers, capacitors and other devices can split the 60-cycle oscillations into harmonics at 120, 180 and even higher vibrations.
But how do GICs affect house-sized transformers in the first place? It seems absurd that a few dozen extra amperes of electricity can make any difference to a transformer delivering thousands of volts of electricity. For a transformer to operate normally, the current and voltage is in a specific phase relationship that has to do with the iron-steel content of the core and the geometry of the transformer. Like two sets of ocean waves lapping up onto the beach 60 times a second, the voltage and currents waves traveling down a line can be out of synch with each other in AC electricity. Depending on the kinds of loads the line is supplying, from electrical motors, to heating elements and fans, the voltage and current can get pulled out of synch to greater or lesser degrees.
When GICs enter a transformer, the added DC current causes the relationship between the AC voltage and current to change at the source of the electricity, not just where it is delivered to your electrical appliance. Because of the way that GIC currents affect the transformer, it only takes a hundred amperes of GIC current or less to cause a transformer to overload during one-half of its 60-cycle operation. As the transformer switches 120 times a second between being saturated and unsaturated, the normal hum of a transformer becomes a raucous, crackling whine. Regions of opposed magnetism as big as your fist in the core steel plates crash about and vibrate the 100-ton transformer nearly as big as a house in a process that physicists call magnetostriction.
The impact that magnetostriction has upon specific transformers is that it generates hot spots inside the transformer where temperatures can increase very rapidly to hundreds of degrees in only a few minutes. Temperature spikes like these can persist for the duration of the magnetic storm which, itself, can last for hours at a time. During the March 1989 storm, a transformer at a nuclear plant in New Jersey was damaged beyond repair as its insulation gave way after years of cumulative GIC damage. Allegheny Power happened to be monitoring a transformer that they knew to be flaky. When the next geomagnetic storm hit in 1992. They saw the transformer reply in minutes, and send temperatures in part of its tank to more than 340 F (171 C). Other transformers have spiked fevers as high as 750 F (400 C). Insulation damage is a cumulative process over the course of many GICs, and it is easy to see how cumulative solar storm and geomagnetic effects were overlooked in the past.
Outright transformer failures are much more frequent in geographic regions where GICs are common. The Northeastern US with the highest rate of detected geomagnetic activity led the pack with 60% more failures. Not only that, but the average working lifetimes of transformers is also shorter in regions with greater geomagnetic storm activity. The rise and fall of these transformer failures even follows a solar activity pattern of roughly 11 years.
The problem doesn’t end with something as dramatic as a transformer heating up and failing catastrophically. Even non-destructive GICs also affect the efficiency at which a power grid is transmitting power. Because we have less power available to support the new demands placed on the power grid, engineers must constantly monitor the efficiency at which power is being generated and delivered. A one- percent drop in efficiency can mean megawatts of power wasted, and millions of dollars in revenue lost.
It isn’t just the transformers and lines that can make you susceptible to GICs, but the very ground under your feet can act as an invisible co-conspirator. It is easier to get currents to flow in low resistance wires than high resistance ones. But rocks have their own patterns of resistance. If your power plant is located over a rock stratum with low resistance, any geomagnetic disturbance will cause a bigger change in the voltages it induces in your local ground, and the bigger this change in ground voltage, the stronger will be the GIC currents that flow into your transformers. Typical daily GICs can run at about 5-10 amperes, but severe geomagnetic storms can cause 100-200 amperes to flow.
A conservative estimate of the damage done by GICs to transformers by Minnesota Power and Electric was $100 million during a solar-maximum period. This includes the replacement of damaged transformers, and the impact of shortened operating lifetimes due to GIC activity. This doesn’t sound like much, especially compared to the out fall from other natural calamities such as hurricanes and tornadoes, but the implied level of electric service disruptions for the dozens of transformers taken out of service is considerable. It is at this point that the effects of invisible geomagnetic storms are greatly multiplied out of proportion to the seemingly innocuous 10 or 50-ampere currents they induce in a house-sized transformer! John Kappenman reflects on all of this by noting that,
“The evolving growth of the North American transmission grid over the past few decades has made the grid, along with the geographical formations occurring in much of North America, the equivalent of a large efficient antenna that is electromagnetically coupled to the disturbance signals produced by [GICs]…yet monitoring is only being done at a handful of the many thousands of possible GIC entry points on the network”
Large transformers cost $10 million, and can require a year or more to replace if spares are not available. During a transformer failure, an affected utility company will have to purchase replacement power from other utilities for as much as $400,000 per day or more. Oak Ridge National Laboratories, meanwhile, estimated that a solar storm event only slightly stronger than the one that caused the Quebec blackout in 1989 would have involved the Northeast United States in a cascading blackout. The experts figured that about $6 billion in damages and lost wages would have resulted from such a widespread involvement. The North American Electric Reliability Council (NAERC) placed the March 1989 and October 1991 storm events in a category equivalent to Hurricane Hugo or the 1989 Loma Prieta Earthquake in San Francisco. But, many consultants for the power industry dispute NAERC’s estimate saying that it is much too low. The $6 billion may not properly include collateral impacts such as lost wages and productivity, spoiled food and a myriad of other human costs that could easily run the losses into the tens of billions of dollars.
The average person has never experienced a brownout or blackout caused by a solar storm event, and this is in large measure due to the intrinsic robustness of the power grid technology. It’s also a matter of old-fashioned good luck! We are entering a new era of substantial increases in electrical power demand that drives power grids to work near their maximum capacities with dramatically eroded operating margins, and for many more days during each year. Large purchases of power from the more vulnerable Canadian power grid places domestic electrical reliability in increasing jeopardy.
Because of the increasing of electrical demand over the last decade, and the insufficiency of communities to build new power plants, North American citizens have created a potentially unstable balance between supply and demand. In 1998, for example, the peak power demand was 648,694 megawatts, compared to the 737,855 megawatts that was available in actual power plant capacity, a margin of only 16%. A decade earlier, this margin was substantially higher. The NAERC has found that we are rapidly reaching a critical condition: The amount of available electrical capacity in excess of peak demand will shrink from 19% during peak summer load conditions in 1995 to 10% by 2004. Over the same period of time, the margins for specific regional power grids such as the ERCOT Interconnection of Texas will shrink from 20% to 1% if none of the proposed power plants are built, and if the expected power plant retirements occur. This means that there is less electricity available for utilities to buy during geomagnetic storms during times when the power grid is working under peak demand conditions. During the March 1989 Quebec blackout, Hydro-Quebec could purchase for few days, thousands of megawatts of ‘excess’ power from other states. As we enter the 21st century, a similar blackout at the same time of the year may take much longer to resolve because less power will be available to purchase. That means that more people will be in the dark and bundled-up in the cold, for a longer period of time on average. As the NAERC noted in a summary of its report,
“Lower capacity margins can diminish the ability of the bulk electric supply systems in North America to respond to higher-than-projected customer demands caused by extreme weather and unexpected equipment shutdowns or outages”
In the Eastern United States, only 24,400 megawatts of new generating capacity will come on-line by 2002, but by then the projected demand will have risen to at least 36,000 megawatts, and perhaps as high as 47,000. As we are forced to operate our electrical utilities with diminishing margins for emergencies, we become much more vulnerable to any kind of outage of equipment no matter what the cause, or how seemingly infrequent. Geomagnetic storms can then grow to become the proverbial straw, which breaks the camel’s back.
The US has only recently warmed-up to GICs as a significant problem requiring serious attention. Countries such as England, Scotland and Finland have been aggressively working on GIC mitigation since 1982. In England, for example, they have a single power utility that includes Scotland and Wales, and also connects with France. During the 1980’s, they endured a number of strikes by coal miners which triggered electrical supply problems and sensitized the populace to just how vulnerable their lifestyles are to even intermittent losses of power. When British electrical engineers and scientists brought GICs to the table, utility managers were much more interested in mitigating even these rare impacts. Having been beat around the head and shoulders by the public, and by politicians, for outages they could not control, the British power industry welcomed any new insight that might keep their customers happy.
In 1991, Bill Feero an electrical engineer from the Research and Management Corporation in State College, Pennsylvania developed a real-time monitoring system called Sunburst, which could measure the GIC currents at hundreds of locations across North America and Europe. All that participating electrical utility companies such as the Potomac Electric and Power Company, Virginia Electric and Power Company, and Baltimore Gas and Electric needed to do was to install a passive measuring device on selected transformers at their sub-stations. These devices, no bigger than a bagel, transmit by phone line, minute-by-minute GIC current measurements to Sunburst headquarters in Pittsburgh. In essence, the system turns the global power grid into a vast space weather gauge. When the readings exceed preset levels, warnings can be sent to the participating power companies to alert them to conditions that could lead to an equipment outage. Moreover, this equipment has also made several important discoveries of its own.
Prior to the advent of ‘Sunburst-2000′, it was thought that GICs could cause power transformer failure only under extreme conditions, and generally, involving only the primary ’60-cycle’ electrical responses of the equipment. Now it is recognized that the higher harmonics of this 60-cycle frequency can also do significant damage by causing stray currents to flow in large turbine generators. Also, capacitor banks, which help maintain network voltages, can be tripped and taken off-line by the voltage spikes produced by these harmonic currents.
One problem with real-time power system monitoring is that, although it is far better than being caught unawares, once a GIC starts to happen, you have precious few seconds to do anything meaningful except perhaps go outside for a smoke. Severe storms like the one that caused the Quebec blackout are preceded by very normal conditions, and within a few seconds the GIC currents rise sharply to their full levels of hundreds of amperes. Local, real-time measurements alone will probably not be enough by themselves to guide plant managers to take meaningful action, although the information can be used in a post-mortem or forensic mode to let plant managers know which devices are the most vulnerable. Another approach is to try to forecast when GICs will happen. This is not as impossible as it seems.
John Kappenman takes satellite data from two million miles out in space and feeds it into a sophisticated computer program called PowerCast. Within seconds, a complete picture appears of the expected GIC currents at a specific transformer a half-hour later. An electrical utility company running PowerCast can look at any line, transformer or other component in their system and immediately read out just what it will do when the solar wind hits the Earth traveling at a million miles per hour. With 30 minutes to spare, it is now possible to put into action a variety of counter-measures to gird the grid from failure.
To make the forecast, satellite data tells a program what the direction of the solar wind magnetic field is at a particular instant. If this polarity is opposite to that in the Northern Hemisphere, a geomagnetic event will be spawned. This event will cause an electrical current to flow in the ionosphere called an ‘auroral electrojet’. As this current flows over head, it causes a sympathetic current to flow in the Earth. PowerCast calculates from the satellite data, the expected strength of the electrojet current, then the amount of induced ground current based on a detailed model of the rock conductivity under a particular transformer or power line. This is all done on a PC computer in real-time.
The lynch pin in this powerful system of GIC forecasting is scientific research satellites such as NASA’s ACE satellite and its on-board solar wind monitor. At a distance of two million miles towards the Sun, its instruments report on the second-by-second changes in the density, speed and magnetic orientation of the solar wind. For decades space scientists have known that when the magnetic polarity of the wind dips southwards, it triggers violent instabilities in the Earth’s magnetic field in the Northern Hemisphere. When like-polarity conditions prevail, the magnetosphere receives a constant but firm pressure from the wind in much the way that two magnets with the same poles facing each other push apart. But when the polarities are opposed, fields intermingle and reconnect into new shapes in a dynamic process. Currents flow in the Polar Regions of the Earth, and it is these currents that cause VAR-generating GICs to bloom like dandelions on the ground.
Ironically, the ACE satellite seems constantly on the verge of cancellation by NASA to make way for newer missions. The fact that ACE data plays such a vital role in GIC forecasting for the power industry seems to be of no special interest to NASA. NASA is, after all, a research organization supported by the US taxpayer, not a for-profit corporation looking for commercialization opportunities. The viability of the ACE mission at NASA hinges totally on its scientific returns and not its potential for practical applications. NASA also has to make way for future missions with the declining, and politically vulnerable, space research budgets that US Congress, in its wisdom, has mandated. Meanwhile, in England, which uses the PowerCast technology, ACE is seen as a powerful ally in keeping their entire multi-billion dollar power system operating reliably. Rutherford Appleton Labs has invested in its own independent ACE satellite tracking station to intercept the solar wind data. Arslain Erinmez, Chief Engineer at the National Grid Company in England, notes that “The British power industry would be happy to do anything it can to keep ACE going”. While the destiny of satellites such as ACE turns completely on how well its scientists can convince NASA and Congress not to terminate it, its politically-silent, commercial clients both domestic and foreign continue to mine its data to help the power industry keep your electricity flowing.

Submit your review | |